
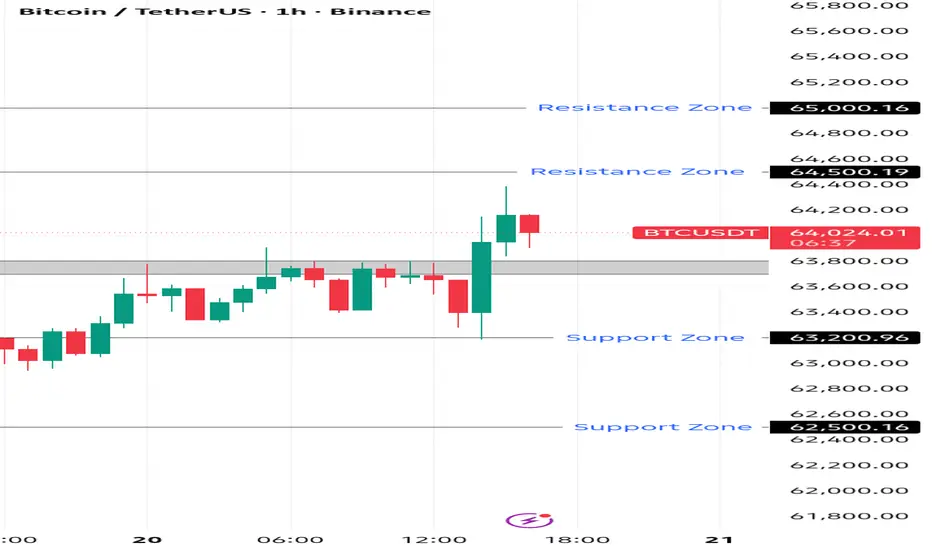
📈 Short-Term Bias: Bullish Recovery 📊 Overall Structure: Still Range / Neutral
What I see on the chart:
BTC bounced strongly from the 62,300–62,500 demand zone.
Price has reclaimed 64,000, which is a positive sign for buyers.
The recent candles are forming higher lows, suggesting bullish momentum is building.
However, BTC is still below the major resistance area around 65,000–66,000.
Key Levels
🟢 Support:
63,700 – 63,800
63,200
62,500
🔴 Resistance:
64,500
65,000
66,000
Trading Idea
🚀 BTCUSDT BUY SETUP
Entry Zone: 63,800 – 64,000 Stop Loss: 63,300
🎯 TP1: 64,500 🎯 TP2: 65,000 🎯 TP3: 65,800
Alternative Sell Setup
If price gets rejected around 64,500–65,000 and forms bearish candles:
📉 Sell
Entry: 64,500 – 64,800
SL: 65,200
TP: 63,800 → 63,200
Market Outlook
✅ Above 63,700, buyers have the advantage. ✅ A breakout above 64,500 could open the door toward 65,000–66,000.
For now, the chart looks more bullish than bearish on the 1H timeframe, but confirmation comes only if BTC breaks and holds above 64,500.
What I see on the chart:
BTC bounced strongly from the 62,300–62,500 demand zone.
Price has reclaimed 64,000, which is a positive sign for buyers.
The recent candles are forming higher lows, suggesting bullish momentum is building.
However, BTC is still below the major resistance area around 65,000–66,000.
Key Levels
🟢 Support:
63,700 – 63,800
63,200
62,500
🔴 Resistance:
64,500
65,000
66,000
Trading Idea
🚀 BTCUSDT BUY SETUP
Entry Zone: 63,800 – 64,000 Stop Loss: 63,300
🎯 TP1: 64,500 🎯 TP2: 65,000 🎯 TP3: 65,800
Alternative Sell Setup
If price gets rejected around 64,500–65,000 and forms bearish candles:
📉 Sell
Entry: 64,500 – 64,800
SL: 65,200
TP: 63,800 → 63,200
Market Outlook
✅ Above 63,700, buyers have the advantage. ✅ A breakout above 64,500 could open the door toward 65,000–66,000.
For now, the chart looks more bullish than bearish on the 1H timeframe, but confirmation comes only if BTC breaks and holds above 64,500.

Declinazione di responsabilità
Le informazioni e le pubblicazioni non sono intese come, e non costituiscono, consulenza o raccomandazioni finanziarie, di investimento, di trading o di altro tipo fornite o approvate da TradingView. Per ulteriori informazioni, consultare i Termini di utilizzo.
Declinazione di responsabilità
Le informazioni e le pubblicazioni non sono intese come, e non costituiscono, consulenza o raccomandazioni finanziarie, di investimento, di trading o di altro tipo fornite o approvate da TradingView. Per ulteriori informazioni, consultare i Termini di utilizzo.