
💀 Hey , how's it going ? Come over here — Satoshi got something for you !
⏰ We’re analyzing BTC on the 1-hour timeframe timeframe .
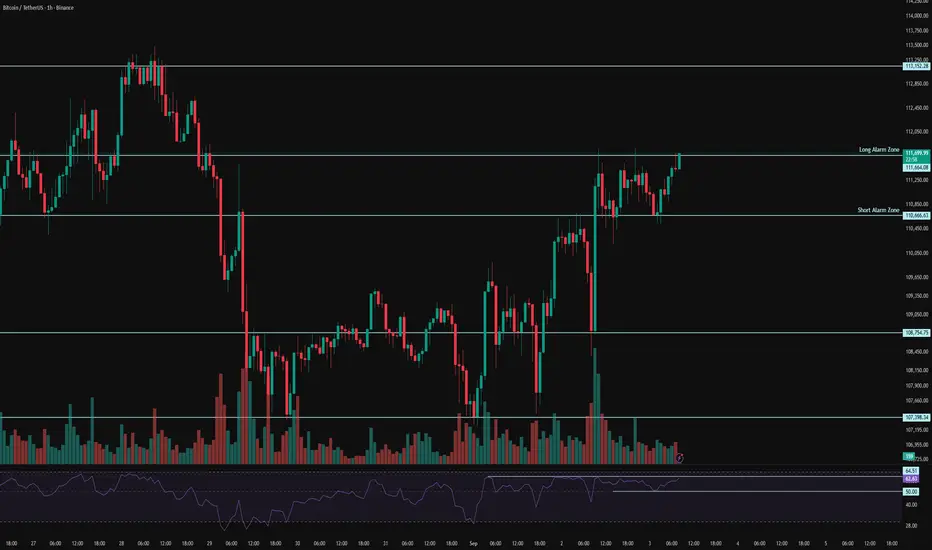
👀 On the 1-hour timeframe of Bitcoin, we can see that after activating the alarm zones we had mentioned in previous analyses, Bitcoin moved upward and is now in a range and compression in its multi-timeframe structure, which with the New York session open could break out of this compression.
⚙️ The key RSI zones are 64 and 50. Once the oscillation limit crosses these zones, Bitcoin could break out of this compression. Preferably, follow long trades when the oscillation limit is crossed.
🕯 The size of green candles on the 1-hour timeframe is almost getting bigger with increasing volume. We are in a relatively important zone where, with the increase of candle size and volume, Bitcoin could move upward.
 📊 On the 1-hour timeframe of USDT.D , we can see that after losing the 4.44% zone and the buyers’ money running out, it has faced a temporary trend weakness. With the New York session open, it could continue its decline. Notice that Tether dominance is also in a compression state both in terms of volatility and the RSI oscillator, in a decision-making mode. Confirmation of breaking the 4.44% zone could mean the loss of the 38 support level.
🔔 The trading alarm zones for Bitcoin are at $111,664 for long and $110,666 for short. Preferably, I’m not considering short trades these days, but I do think about opening a long position on a pullback or breakout of $111,664, and if the price action behavior suits such a trade, I will take action.
❤️ Disclaimer : This analysis is purely based on my personal opinion and I only trade if the stated triggers are activated .
⏰ We’re analyzing BTC on the 1-hour timeframe timeframe .
👀 On the 1-hour timeframe of Bitcoin, we can see that after activating the alarm zones we had mentioned in previous analyses, Bitcoin moved upward and is now in a range and compression in its multi-timeframe structure, which with the New York session open could break out of this compression.
⚙️ The key RSI zones are 64 and 50. Once the oscillation limit crosses these zones, Bitcoin could break out of this compression. Preferably, follow long trades when the oscillation limit is crossed.
🕯 The size of green candles on the 1-hour timeframe is almost getting bigger with increasing volume. We are in a relatively important zone where, with the increase of candle size and volume, Bitcoin could move upward.
🔔 The trading alarm zones for Bitcoin are at $111,664 for long and $110,666 for short. Preferably, I’m not considering short trades these days, but I do think about opening a long position on a pullback or breakout of $111,664, and if the price action behavior suits such a trade, I will take action.
❤️ Disclaimer : This analysis is purely based on my personal opinion and I only trade if the stated triggers are activated .

🔥 Join the Action Now 🔥
☄️ Telegram
t.me/FireHoseReel
☄️ Trade & Earn
bitunix.com/register?inviteCode=28r21f
☄️ Telegram
t.me/FireHoseReel
☄️ Trade & Earn
bitunix.com/register?inviteCode=28r21f
Pubblicazioni correlate
Declinazione di responsabilità
Le informazioni e le pubblicazioni non sono intese come, e non costituiscono, consulenza o raccomandazioni finanziarie, di investimento, di trading o di altro tipo fornite o approvate da TradingView. Per ulteriori informazioni, consultare i Termini di utilizzo.
🔥 Join the Action Now 🔥
☄️ Telegram
t.me/FireHoseReel
☄️ Trade & Earn
bitunix.com/register?inviteCode=28r21f
☄️ Telegram
t.me/FireHoseReel
☄️ Trade & Earn
bitunix.com/register?inviteCode=28r21f
Pubblicazioni correlate
Declinazione di responsabilità
Le informazioni e le pubblicazioni non sono intese come, e non costituiscono, consulenza o raccomandazioni finanziarie, di investimento, di trading o di altro tipo fornite o approvate da TradingView. Per ulteriori informazioni, consultare i Termini di utilizzo.