
Hello, fellow traders.
By "Following," you'll always get the latest information quickly.
Have a great day.
-------------------------------------
How can we confirm that the price is supported at support and resistance levels?
While support can be determined over time, it's not always easy to tell when support is being tested.
The indicators we focus on are the HA-Low and HA-High indicators.
Then, in combination with the DOM(-60) and DOM(60) indicators, we identify low and high ranges and respond based on whether they are supported.
In other words, we can use the basic trading strategy of buying if support is found in the DOM(-60) to HA-Low range, and selling if resistance is found in the HA-High to DOM(60) range.
-
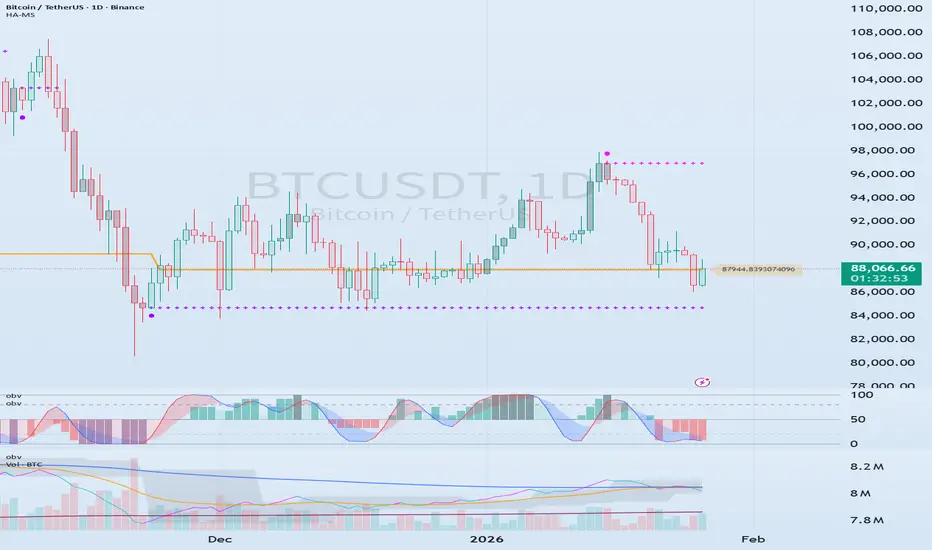
The current price is located near the DOM(-60) ~ HA-Low range.
The DOM(-60) indicator has been maintained since its creation.
Therefore, we can see that support is currently being tested near the DOM(-60) ~ HA-Low range.
So, how can we determine if support is found and an upward trend is possible?
This can be predicted by observing the movements of the OBV, StochRSI, and TC indicators.
Since the current price is located near the HA-Low indicator, for the HA-Low indicator to support the price and move upward, the StochRSI, TC, and OBV indicators must be trending upward.
If possible,
1. The StochRSI indicator should not have entered the overbought zone.
2. The TC indicator should remain above zero.
3. The OBV indicator should remain above the High Line.
Applying the above conditions, we can see that support is still present and the likelihood of an upward trend is low.
Even under these conditions, if the price remains near the DOM(-60) ~ HA-Low range, we can say that support is present.
-
To examine the situation in more detail, let's examine the movement on the 15m chart.
To determine whether support exists near the HA-Low indicator point on the 1D chart, I've marked the HA-Low indicator point on the 1D chart.
The DOM(-60) and HA-Low indicators are generated on the 15m chart, and the upward movement is testing support as it meets the DOM(60) indicator.
Therefore, even if the price declines from the HA-Low indicator point (87944.84) on the 1D chart, if it maintains around the DOM (-60) ~ HA-Low range on the 15m chart, it will likely attempt to rise again.
To achieve this, as mentioned earlier, we must monitor the movements of the StochRSI, TC, and OBV indicators.
If the StochRSI indicator enters the overbought zone, the upward movement may be limited.
Therefore, to sustain the uptrend, it is best to ensure the StochRSI indicator has not entered the overbought zone.
The TC indicator is a comprehensive evaluation of the OBV + PVT + StochRSI indicators. An increase above the zero point indicates that buying pressure is dominant, while a decrease indicates that selling pressure is dominant.
Therefore, even if the TC indicator shows an upward trend, the uptrend is likely to continue only if it rises above the zero point.
The OBV indicator should be divided into three sections:
1. Low Line ~ High Line
2. Above the High Line
3. Below the Low Line
1. Low Line ~ High Line
If the OBV indicator is within the Low Line ~ High Line range, it is best to assume that the price has entered a sideways trading range.
Whether this sideways trading range is bullish or bearish can be determined by examining the trend of the channel formed by the Low Line ~ High Line.
Since the channel formed by the Low Line ~ High Line is currently forming an upward channel, it should be interpreted as being within a bullish sideways trading range.
2. Above the High Line
For the price to break out of the sideways trading range and enter an uptrend, it must rise above the High Line.
3. Below the Low Line
For the price to break out of the sideways trading range and enter a downtrend, it must fall below the Low Line.
Therefore, based on the movements of the StochRSI, TC, and OBV indicators, we should consider the current price unlikely to continue its upward trend and develop a response strategy.
-
Support may require observing the price movement for 1 to 3 days.
However, the price has been held near the DOM (-60) ~ HA-Low range for over two months.
Therefore, it's correct to interpret the current price as being in an upward sideways range.
If the OBV indicator falls below the Low Line and then below the DOM (-60) indicator, it will break out of the sideways range and enter a downtrend.
This is the answer to the question of whether the current price is supported.
For the price to show an upward trend, it must rise above at least DOM(-60) to HA-Low.
To create a stepwise uptrend, or a full-blown uptrend, it must rise above HA-High to DOM(60).
Therefore, if the current price rises from the DOM(-60) to HA-Low range, the resistance zone will be the HA-High to DOM(60) range.
Since the HA-High and HA-Low indicators are the most important indicators, the price must rise above the HA-High indicator and remain there for a full-blown uptrend to occur.
-
Thank you for reading to the end.
I wish you successful trading.
--------------------------------------------------
Nota
#BTCUSDTBased on the current price, key support and resistance levels are 87944.84 and 98745.09.
Therefore, the key question is whether the price can find support near 87944.84 and rise above 98745.09.
To achieve this, the price must rise above the M-Signal indicator on the 1M chart and remain there.
In other words, we must first determine whether the price can rise above the 89682.02 to 91013.65 range.
If the price rises above 91013.65, the key question is whether the price can rise above the M-Signal indicator on the 1W chart.
To achieve this, the price must rise above the 92631.0 level, the StochRSI 50 indicator on the 1D chart, and remain there.
If this rise occurs, it will likely be a bullish trend, as it has risen above the M-Signal indicator on the 1M, 1W, and 1D charts.
However, for the price to rise above the important support and resistance level of 98745.09, the StochRSI, TC, and OBV indicators must show upward trends upon the upward breakout.
If possible,
1. The StochRSI indicator should not have entered the overbought zone.
2. The TC indicator should remain above zero.
3. The OBV indicator should remain above the High Line.
If these conditions are met, there is a possibility of an upward breakout above 98745.09 and the uptrend will continue.
By monitoring the movements of the StochRSI, TC, and OBV indicators when the price breaks through the support and resistance levels you've drawn, you can determine the potential for further upside.
It is difficult to see an immediate upward movement as the StochRSI, TC, and OBV indicators indicate that it is difficult to continue the upward trend by breaking above the M-Signal indicator on the current 1M chart.

[Practical trading strategy using HA-MS and SBOD]
youtu.be/aceN1AttX1Y
youtu.be/aceN1AttX1Y
Declinazione di responsabilità
Le informazioni e le pubblicazioni non sono intese come, e non costituiscono, consulenza o raccomandazioni finanziarie, di investimento, di trading o di altro tipo fornite o approvate da TradingView. Per ulteriori informazioni, consultare i Termini di utilizzo.
[Practical trading strategy using HA-MS and SBOD]
youtu.be/aceN1AttX1Y
youtu.be/aceN1AttX1Y
Declinazione di responsabilità
Le informazioni e le pubblicazioni non sono intese come, e non costituiscono, consulenza o raccomandazioni finanziarie, di investimento, di trading o di altro tipo fornite o approvate da TradingView. Per ulteriori informazioni, consultare i Termini di utilizzo.