
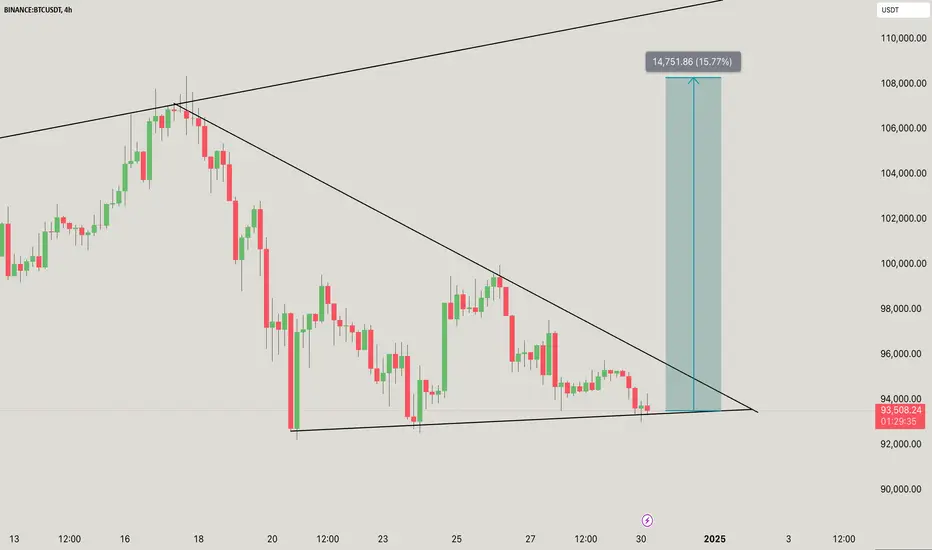
BTC/USDT consolidates within a symmetrical triangle, indicating a potential breakout.
This pattern often translates into a significant price movement, either upwards or downwards.
As highlighted in the chart, if BTC breaks out to the upside, the price projection is approximately 15.77%.
The measured move aligns with historical price action and the triangle's width.
Support Level: Near $93,000
The breakout of the triangle will determine the next directional trend.
Keep an eye on increased trading volume to confirm the validity of the breakout.
If the breakout is bullish: The potential target is $108,000
Let me know if you’d like further assistance or adjustments!
DYOR. NFA

Pubblicazioni correlate
Declinazione di responsabilità
Le informazioni e le pubblicazioni non sono intese come, e non costituiscono, consulenza o raccomandazioni finanziarie, di investimento, di trading o di altro tipo fornite o approvate da TradingView. Per ulteriori informazioni, consultare i Termini di utilizzo.
Pubblicazioni correlate
Declinazione di responsabilità
Le informazioni e le pubblicazioni non sono intese come, e non costituiscono, consulenza o raccomandazioni finanziarie, di investimento, di trading o di altro tipo fornite o approvate da TradingView. Per ulteriori informazioni, consultare i Termini di utilizzo.