
Bitcoin Price Analysis 16-08-2022
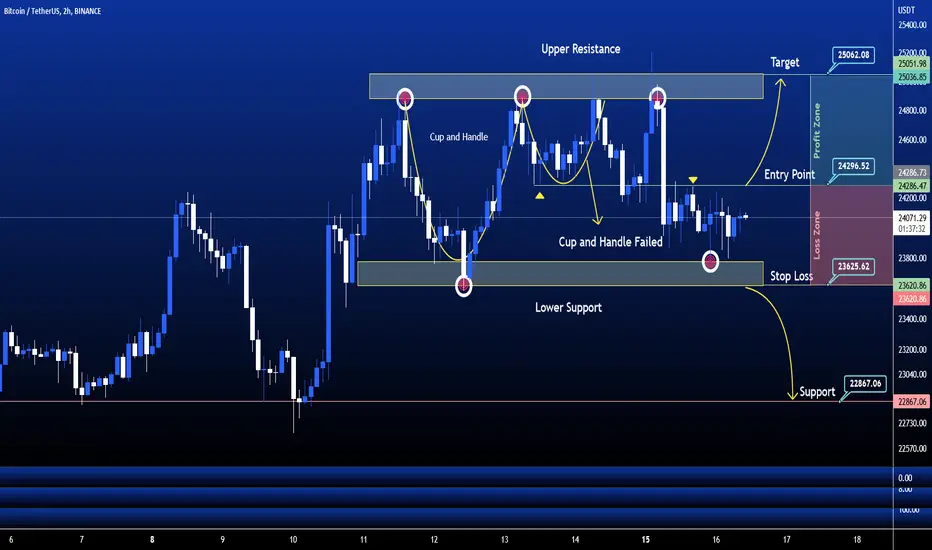
The above chart of Bitcoin ( BTCUSDT ) laid out the Horizontal channel pattern. Horizontal channel also known as the sideways trend. In order to indicate how the price is constrained between the upper line of resistance and lower line of support, horizontal channels are trend lines that join changeable price highs and lows.
Currently, Bitcoin ( BTCUSDT ) is in the range of $24065. If the pattern continues, the price of Bitcoin ( BTCUSDT ) might reach the resistance levels of $25060 and $0.1052. If the trend reverses, then the price of HBAR may fall to $23625.
Short Note :
Buy Level : $24300
Target : $25060
Stop Loss : $23625
Happy Trading $$$
The above chart of Bitcoin ( BTCUSDT ) laid out the Horizontal channel pattern. Horizontal channel also known as the sideways trend. In order to indicate how the price is constrained between the upper line of resistance and lower line of support, horizontal channels are trend lines that join changeable price highs and lows.
Currently, Bitcoin ( BTCUSDT ) is in the range of $24065. If the pattern continues, the price of Bitcoin ( BTCUSDT ) might reach the resistance levels of $25060 and $0.1052. If the trend reverses, then the price of HBAR may fall to $23625.
Short Note :
Buy Level : $24300
Target : $25060
Stop Loss : $23625
Happy Trading $$$

Pubblicazioni correlate
Declinazione di responsabilità
Le informazioni e le pubblicazioni non sono intese come, e non costituiscono, consulenza o raccomandazioni finanziarie, di investimento, di trading o di altro tipo fornite o approvate da TradingView. Per ulteriori informazioni, consultare i Termini di utilizzo.
Pubblicazioni correlate
Declinazione di responsabilità
Le informazioni e le pubblicazioni non sono intese come, e non costituiscono, consulenza o raccomandazioni finanziarie, di investimento, di trading o di altro tipo fornite o approvate da TradingView. Per ulteriori informazioni, consultare i Termini di utilizzo.