
Hello?
Nice to meet you, fellow traders.
If you "follow" me, you can always get new information quickly.
Have a great day.
------------------------------------
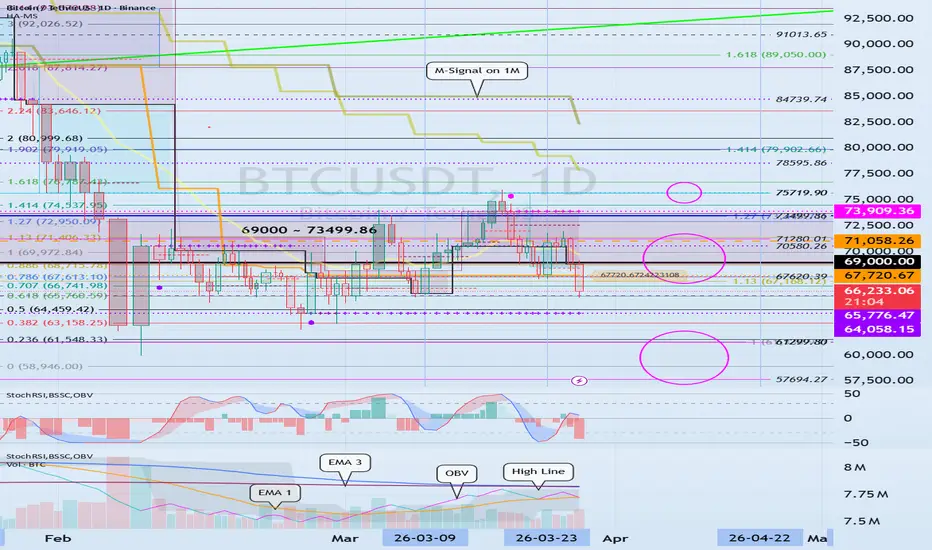
(BTCUSDT 1D Chart)
From a chart analysis perspective, the important range is between 69000.0 and 73909.36.
This is because if it falls below this level, there is a high probability that it will show a downtrend in the mid-to-long term.
Therefore, from a chart analysis perspective, I believe it is appropriate to explain countermeasures for a mid-to-long-term downtrend.
However, from a trading perspective, the most critical range is the 57,694.27 to 61,299.80 range.
This is because a drop below this level would mean falling below the previous high point; thus, this is a zone that must be supported to sustain an uptrend in the mid-to-long term.
Currently, the HA-Low indicator point on the 1W chart is formed at 71,058.26, and the HA-Low indicator on the 1D chart is formed at 67,720.67.
The formation of the HA-Low indicator signifies that a low point zone has been established.
Therefore, if it shows signs of being supported near the HA-Low indicator, it is a buying opportunity.
If this fails and the price falls, there is a possibility of a stepwise decline, so you must consider countermeasures.
Since the end of a stepwise decline is an uptrend, you must ultimately consider how to proceed with buying.
- (1W Chart)
Looking at the 1W chart, you can understand why the creation of the HA-Low indicator on the 1W chart is important.
While there is no guarantee that past movements will appear similarly in the present, this is because if the price maintains the range of 57,694.27 to 61,299.80 mentioned in the 1D chart, or above that level, it is expected to show an upward trend.
- (1M Chart)
You can identify the previous high point by looking at the 1M chart.
----------------------------------
Therefore,
from a mid-to-long-term perspective, the buying timing corresponds to the area between 57,694.27 and 61,299.80,
and from a short-to-medium-term perspective, the buying timing corresponds to the area between 67,620.39 and 71,058.26.
Thus, you can proceed with the position currently in the buying phase.
However, since the price is located below the M-Signal indicator on the 1M chart, position sizing adjustments are necessary.
This is because a full-scale uptrend is highly likely to begin when the price maintains a level above the M-Signal indicator on the 1M chart.
Looking at the current price position at 75,719.90, this corresponds to the StochRSI 20 indicator point on the 1M chart.
Therefore, the likelihood of an upward trend is increasing as the price breaks above the 75,719.90 point.
Therefore, if the price rises when the StochRSI 20 indicator on the 1M chart maintains the 75,719.90 level and the M-Signal indicator passes near this point, that can be considered the final buying opportunity.
After passing through the volatility period around March 23, the price appears to be feigning an upward trend before falling.
The next volatility period is around April 22, but looking at the ETHUSDT chart, a volatility period exists around April 2.
Therefore, you should consider a response strategy assuming there is a possibility that a trend will form after April 2.
To sustain an uptrend after breaking out of a key point or zone, the StochRSI, BSSC, and OBV indicators must show an upward trend.
In particular,
1. It is preferable that the StochRSI indicator has not entered the overbought zone. 2. It is advisable for the BSSC indicator to remain above the 0 point.
3. It is advisable for the OBV indicator to remain above the High Line.
When the price breaks upward from any point or zone, you must verify whether the above conditions are satisfied and formulate a trading strategy accordingly.
- Thank you for reading to the end.
I wish you successful trading.
-------------------------------------------------
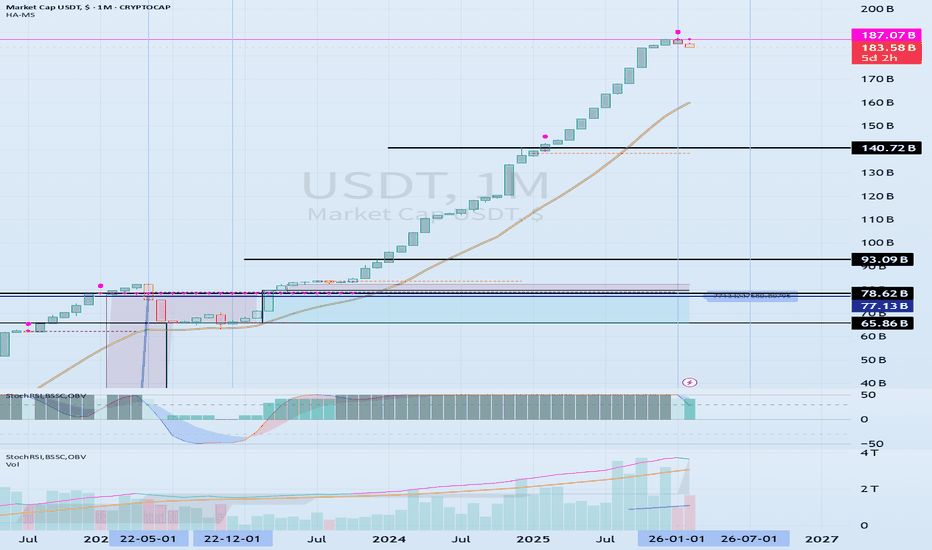
(The coin market is expected to start its uptrend in July)
-
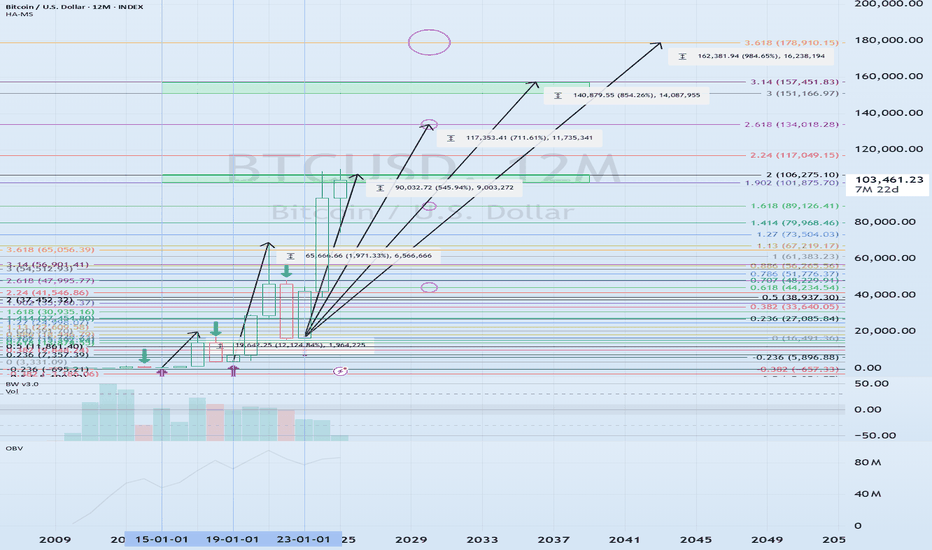
- This is an explanation of the big picture.
(3-year bull market, 1-year bear market pattern)
------------------------------------------------------
Trade attivo
The Low Line of the OBV indicator on the 1D chart is showing signs of rising.
Accordingly, we need to examine whether the OBV indicator can maintain a level above the Low Line or rise.
Since the channel formed by the Low Line to High Line segment is maintaining an upward channel, the key is whether it can rise along this upward channel.
Looking at the 15m chart, the HA-Low indicator is being generated as it rises.
Therefore, the key is whether it can find support around 66613.76 and rise this time. I believe that for an uptrend to begin, the OBV indicator must be maintained at EMA 3 or higher.
To rise from the low point, it must rise above the previous HA-Low indicator point of 68657.87.
Since the period of ETH volatility is around April 2 (April 1–3), attention should be paid to volatility.

YouTube: youtube.com/@readcrypto9837
※ Follow X to check out the posts.
※ X를 팔로우하고 게시물을 확인하세요.
◆ t.me/readCryptoChannel
[HA-MS Indicator]
bit.ly/3YxHgvN
[OBV Indicator]
bit.ly/4dcyny3
※ Follow X to check out the posts.
※ X를 팔로우하고 게시물을 확인하세요.
◆ t.me/readCryptoChannel
[HA-MS Indicator]
bit.ly/3YxHgvN
[OBV Indicator]
bit.ly/4dcyny3
Pubblicazioni correlate
Declinazione di responsabilità
Le informazioni e le pubblicazioni non sono intese come, e non costituiscono, consulenza o raccomandazioni finanziarie, di investimento, di trading o di altro tipo fornite o approvate da TradingView. Per ulteriori informazioni, consultare i Termini di utilizzo.
YouTube: youtube.com/@readcrypto9837
※ Follow X to check out the posts.
※ X를 팔로우하고 게시물을 확인하세요.
◆ t.me/readCryptoChannel
[HA-MS Indicator]
bit.ly/3YxHgvN
[OBV Indicator]
bit.ly/4dcyny3
※ Follow X to check out the posts.
※ X를 팔로우하고 게시물을 확인하세요.
◆ t.me/readCryptoChannel
[HA-MS Indicator]
bit.ly/3YxHgvN
[OBV Indicator]
bit.ly/4dcyny3
Pubblicazioni correlate
Declinazione di responsabilità
Le informazioni e le pubblicazioni non sono intese come, e non costituiscono, consulenza o raccomandazioni finanziarie, di investimento, di trading o di altro tipo fornite o approvate da TradingView. Per ulteriori informazioni, consultare i Termini di utilizzo.