
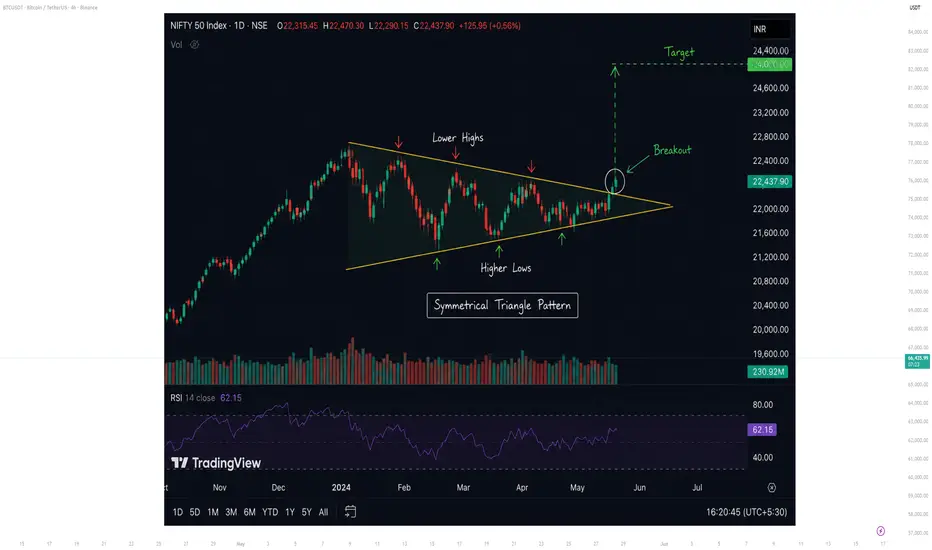
1. Price Starts to Tighten
After a strong move, the market stops trending and begins to create lower highs and higher lows. This forms a symmetrical triangle, showing that buyers and sellers are reaching a balance.
2. Momentum Builds Inside the Pattern
As the triangle gets smaller, volatility decreases and price movements become tighter. This often signals that a powerful move is getting closer.
3. Volume Tells the Story
During the formation of the triangle, trading volume usually drops. A sudden increase in volume during the breakout can be a strong confirmation that momentum is returning.
4. The Breakout Changes Everything
A daily candle closing above the upper trendline suggests that buyers have taken control. Many traders wait for this confirmation instead of entering early.
5. Managing Risk Is Simple
A practical stop loss can be placed below the last higher low or just under the lower trendline. This keeps the trade disciplined and limits unnecessary losses.
6. Measuring the Target
The expected target is often calculated by measuring the widest part of the triangle and projecting the same distance from the breakout point. This provides a logical price objective instead of guessing.
7. Final Thoughts
The Symmetrical Triangle pattern is not about predicting the market—it is about waiting for confirmation. When combined with strong volume, trend direction, and proper risk management, this pattern can offer high-quality trading opportunities while keeping the strategy simple and consistent.
After a strong move, the market stops trending and begins to create lower highs and higher lows. This forms a symmetrical triangle, showing that buyers and sellers are reaching a balance.
2. Momentum Builds Inside the Pattern
As the triangle gets smaller, volatility decreases and price movements become tighter. This often signals that a powerful move is getting closer.
3. Volume Tells the Story
During the formation of the triangle, trading volume usually drops. A sudden increase in volume during the breakout can be a strong confirmation that momentum is returning.
4. The Breakout Changes Everything
A daily candle closing above the upper trendline suggests that buyers have taken control. Many traders wait for this confirmation instead of entering early.
5. Managing Risk Is Simple
A practical stop loss can be placed below the last higher low or just under the lower trendline. This keeps the trade disciplined and limits unnecessary losses.
6. Measuring the Target
The expected target is often calculated by measuring the widest part of the triangle and projecting the same distance from the breakout point. This provides a logical price objective instead of guessing.
7. Final Thoughts
The Symmetrical Triangle pattern is not about predicting the market—it is about waiting for confirmation. When combined with strong volume, trend direction, and proper risk management, this pattern can offer high-quality trading opportunities while keeping the strategy simple and consistent.

Declinazione di responsabilità
Le informazioni e le pubblicazioni non sono intese come, e non costituiscono, consulenza o raccomandazioni finanziarie, di investimento, di trading o di altro tipo fornite o approvate da TradingView. Per ulteriori informazioni, consultare i Termini di utilizzo.
Declinazione di responsabilità
Le informazioni e le pubblicazioni non sono intese come, e non costituiscono, consulenza o raccomandazioni finanziarie, di investimento, di trading o di altro tipo fornite o approvate da TradingView. Per ulteriori informazioni, consultare i Termini di utilizzo.