
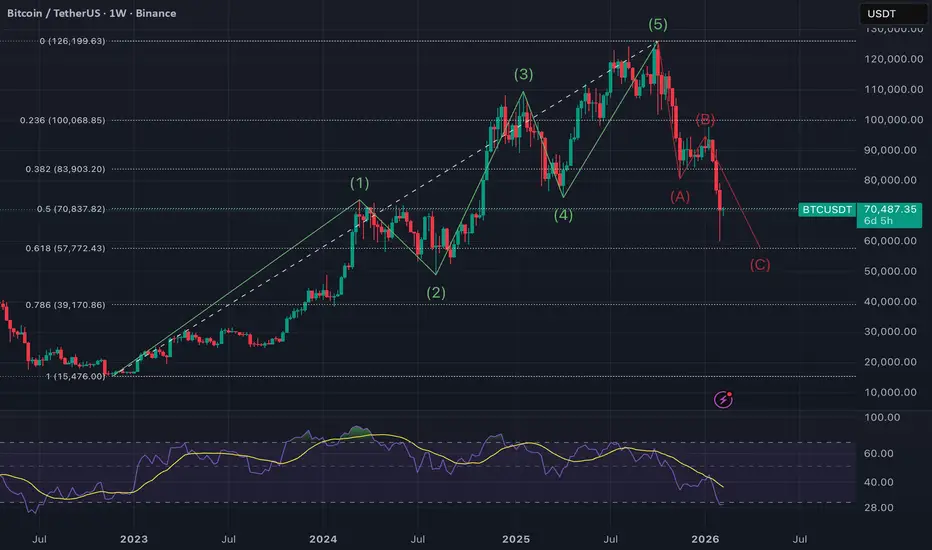
This idea presents a high-timeframe Elliott Wave analysis on BTC/USDT (1W), suggesting that Bitcoin has likely completed a full 5-wave impulsive cycle and is now unfolding a corrective ABC structure, with Wave C currently in progress.
The goal of this post is educational first: to illustrate how Elliott Wave Theory structures market cycles, while also integrating macro-economic and geopolitical factors that may influence Bitcoin price action in the coming months.
Elliott Wave Structure Explained
According to Elliott Wave Theory, markets move in fractal cycles:
On this chart:
Wave A: sharp impulsive decline
Wave B: corrective rebound (often deceptive and sentiment-driven)
Wave C: typically the strongest and most emotional leg, often matching or exceeding Wave A in magnitude
Current price action suggests BTC is developing Wave C, which historically aligns with:
Technical Confluence
Several technical elements support the Wave C hypothesis:
Wave C often seeks liquidity zones, prior consolidation ranges, or deeper Fibonacci retracements before a larger trend resumes.
Macro, Economic & Political Context
Beyond pure technicals, Bitcoin does not move in isolation. Current macro conditions that may amplify corrective pressure include:
These factors do not invalidate Bitcoin’s long-term thesis, but they align well with a corrective Wave C environment.
Important Notes
Corrections are not the end of a trend — they are the price paid for the next expansion.
Final Thought
Wave C is often where fear peaks and opportunity quietly forms. Whether this scenario plays out fully or partially, understanding where we are in the market cycle provides a strong strategic edge, especially on higher timeframes.
If you find this breakdown useful or educational, feel free to like, comment, or share your alternative counts — market structure thrives on discussion.
The goal of this post is educational first: to illustrate how Elliott Wave Theory structures market cycles, while also integrating macro-economic and geopolitical factors that may influence Bitcoin price action in the coming months.
Elliott Wave Structure Explained
According to Elliott Wave Theory, markets move in fractal cycles:
- 5 waves in the direction of the main trend (Impulse)
- 3 waves against the trend (Correction: A-B-C)
On this chart:
- Waves (1) to (5) form a clear impulsive advance
- Momentum divergence and structural exhaustion appear near the Wave (5) top
- The market then transitions into a corrective phase
Wave A: sharp impulsive decline
Wave B: corrective rebound (often deceptive and sentiment-driven)
Wave C: typically the strongest and most emotional leg, often matching or exceeding Wave A in magnitude
Current price action suggests BTC is developing Wave C, which historically aligns with:
- Increasing fear
- Negative narratives
- Macro uncertainty
- Liquidity tightening
Technical Confluence
Several technical elements support the Wave C hypothesis:
- Breakdown below key Fibonacci retracement levels
- Loss of prior macro support zones
- Weak momentum structure on higher timeframes
- RSI trending into bearish territory, consistent with corrective phases rather than impulsive rallies
Wave C often seeks liquidity zones, prior consolidation ranges, or deeper Fibonacci retracements before a larger trend resumes.
Macro, Economic & Political Context
Beyond pure technicals, Bitcoin does not move in isolation. Current macro conditions that may amplify corrective pressure include:
- Monetary policy uncertainty
High interest rates and delayed rate cuts reduce speculative liquidity, impacting risk assets like crypto. - USD strength vs global currencies
A strong dollar historically pressures BTC during corrective phases. - Geopolitical instability
Wars, trade tensions, and political polarization increase short-term volatility and risk aversion. - Regulatory pressure & narrative cycles
Regulatory uncertainty often peaks during market corrections — right when sentiment is weakest.
These factors do not invalidate Bitcoin’s long-term thesis, but they align well with a corrective Wave C environment.
Important Notes
- Elliott Wave counts are probabilistic, not absolute
- Alternative counts always exist
- This is not financial advice
- Always manage risk and confirm with your own tools
Corrections are not the end of a trend — they are the price paid for the next expansion.
Final Thought
Wave C is often where fear peaks and opportunity quietly forms. Whether this scenario plays out fully or partially, understanding where we are in the market cycle provides a strong strategic edge, especially on higher timeframes.
If you find this breakdown useful or educational, feel free to like, comment, or share your alternative counts — market structure thrives on discussion.
Trade chiuso: obiettivo raggiunto
Wave C ended at 57800$ (Fib 0.618) just 27$ diff from the level indicated on the graph!
Declinazione di responsabilità
Le informazioni e le pubblicazioni non sono intese come, e non costituiscono, consulenza o raccomandazioni finanziarie, di investimento, di trading o di altro tipo fornite o approvate da TradingView. Per ulteriori informazioni, consultare i Termini di utilizzo.
Declinazione di responsabilità
Le informazioni e le pubblicazioni non sono intese come, e non costituiscono, consulenza o raccomandazioni finanziarie, di investimento, di trading o di altro tipo fornite o approvate da TradingView. Per ulteriori informazioni, consultare i Termini di utilizzo.