
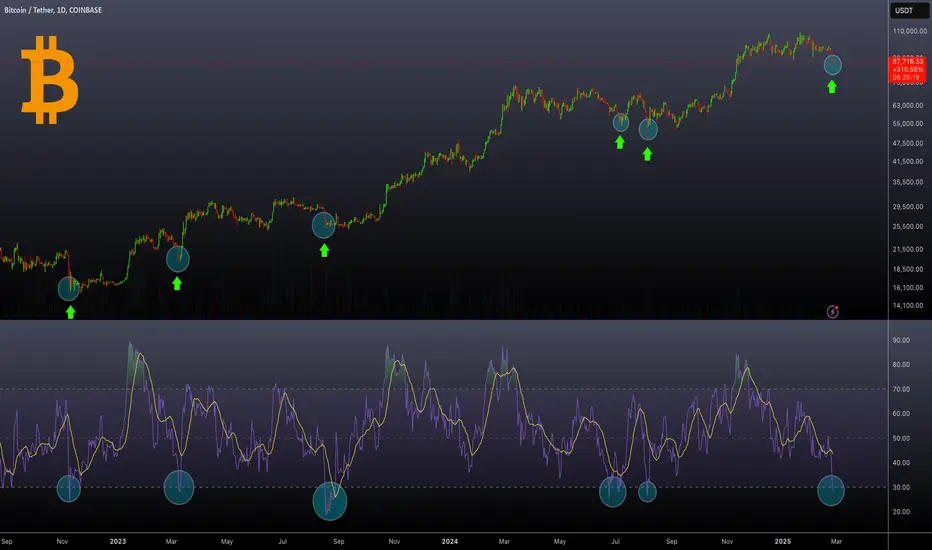
The above chart highlights Bitcoin's price action alongside the Relative Strength Index (RSI) on a daily timeframe. Historically, every time the RSI dropped below 30, indicating oversold conditions, Bitcoin experienced a price bounce shortly after. The chart marks these moments with blue circles and green arrows, showing clear upward reversals following each dip. Currently, Bitcoin's RSI has once again fallen below 30, with the price around $87,000 after a sharp 10% drop. If past patterns hold true, this could signal an upcoming bullish reversal.
Trade attivo
BTC - RSI chart updatePerfect bounce from $80K level

🚀Telegram : t.me/hexatrades
🌐Website: hexatrades.io/
🗣️Twitter(X): twitter.com/HexaTrades
🌐Website: hexatrades.io/
🗣️Twitter(X): twitter.com/HexaTrades
Pubblicazioni correlate
Declinazione di responsabilità
Le informazioni e le pubblicazioni non sono intese come, e non costituiscono, consulenza o raccomandazioni finanziarie, di investimento, di trading o di altro tipo fornite o approvate da TradingView. Per ulteriori informazioni, consultare i Termini di utilizzo.
🚀Telegram : t.me/hexatrades
🌐Website: hexatrades.io/
🗣️Twitter(X): twitter.com/HexaTrades
🌐Website: hexatrades.io/
🗣️Twitter(X): twitter.com/HexaTrades
Pubblicazioni correlate
Declinazione di responsabilità
Le informazioni e le pubblicazioni non sono intese come, e non costituiscono, consulenza o raccomandazioni finanziarie, di investimento, di trading o di altro tipo fornite o approvate da TradingView. Per ulteriori informazioni, consultare i Termini di utilizzo.