
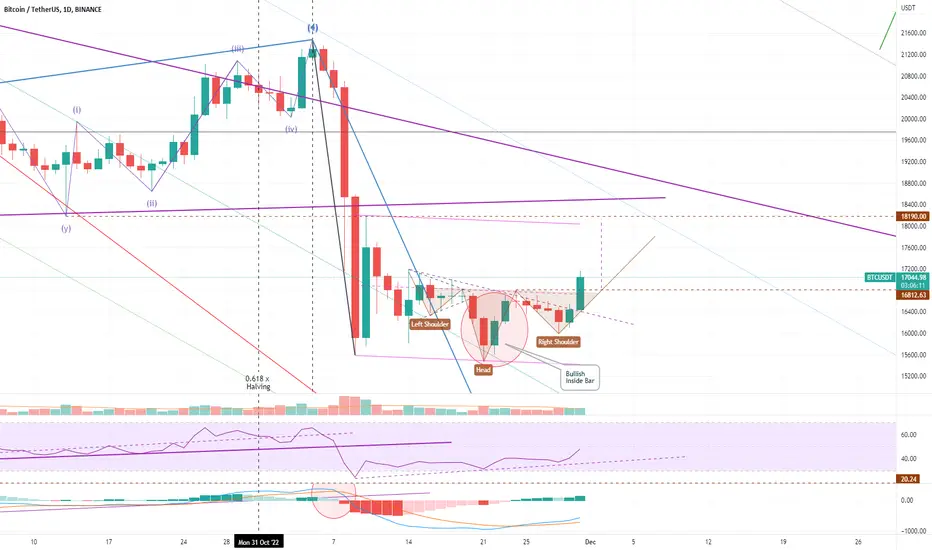
In this chart I note the completion of an Inverse Head and Shoulders pattern that and a bullish Inside Bar formation following the $15.5k low.
I consider the line of support offered within the Fibonacci Channel that has defined the entire Bitcoin bear market to date and wonder if this is not a natural bottom for Bitcoin.
What do you think? Is the bottom in? Or are we still yet to see the rug pulled again and new lows form?
I consider the line of support offered within the Fibonacci Channel that has defined the entire Bitcoin bear market to date and wonder if this is not a natural bottom for Bitcoin.
What do you think? Is the bottom in? Or are we still yet to see the rug pulled again and new lows form?

Pubblicazioni correlate
Declinazione di responsabilità
Le informazioni e le pubblicazioni non sono intese come, e non costituiscono, consulenza o raccomandazioni finanziarie, di investimento, di trading o di altro tipo fornite o approvate da TradingView. Per ulteriori informazioni, consultare i Termini di utilizzo.
Pubblicazioni correlate
Declinazione di responsabilità
Le informazioni e le pubblicazioni non sono intese come, e non costituiscono, consulenza o raccomandazioni finanziarie, di investimento, di trading o di altro tipo fornite o approvate da TradingView. Per ulteriori informazioni, consultare i Termini di utilizzo.