
1️⃣ Market Structure
The most important thing to see:
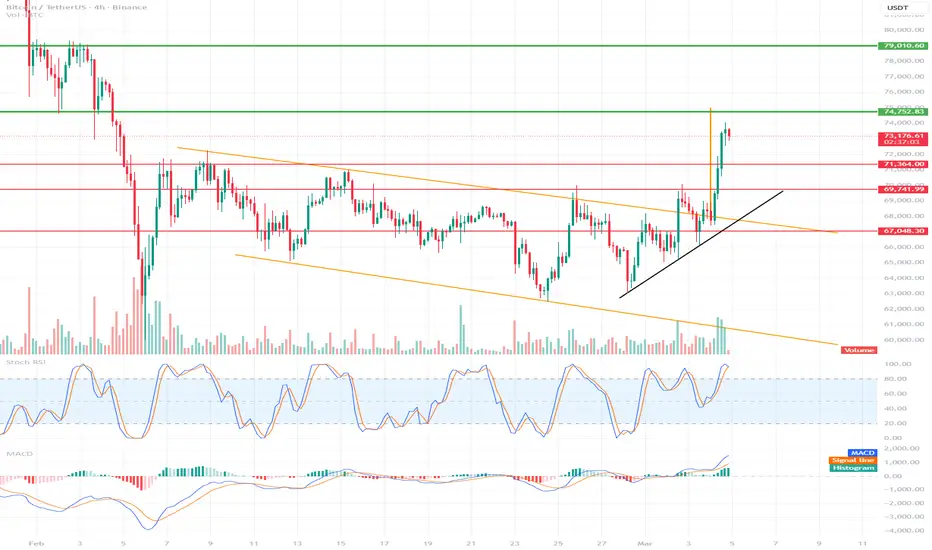
The price has broken out of the downward channel (orange lines)
A strong impulse breakout has occurred
The breakout has broken through:
The downward trendline
Resistance 69.7k
Resistance 71.3k
This is a change in market structure → bullish.
The black line shows a valid impulse + potential retest.
📈 Key Levels
🟢 Resistance
74,750 – very strong resistance (currently being tested)
77,100
79,000 – macro resistance
🔴 Support
71,300 – fresh support
69,740
67,050 – very strong
Most important level now:
👉 71,300
If maintained, the uptrend continues.
📉 Indicators
Stoch RSI
is high (overbought)
A short pullback is possible
This is normal after such an impulse.
MACD
Fresh bullish crossover
The histogram is rising
Momentum is rising
This usually means a few more bullish candles remain.
📊 Volume
The breakout showed:
📈 high volume
This is important because:
the breakout is real
does not look like a fake breakout
🔮 Scenarios
🟢 Bullish (more likely)
Pullback to:
71.3k – 72k
and beyond:
🎯 74.7k → 77k → 79k
🟡 Consolidation
The price could box:
71k – 75k
for a few days before moving higher.
🔴 Bearish (only after a break)
If it drops below:
69,700
then possible:
67k
65k
But there is no bearish signal yet.
🧠 The most important thing that happened
This is key:
👉 BTC has broken out of a downtrend
meaning:
the structure is changing to bullish
the next leg of growth is possible
⭐ My conclusion
Short-term:
📉 a small pullback is possible
Medium-term:
📈 77k – 79k is realistic
The most important thing to see:
The price has broken out of the downward channel (orange lines)
A strong impulse breakout has occurred
The breakout has broken through:
The downward trendline
Resistance 69.7k
Resistance 71.3k
This is a change in market structure → bullish.
The black line shows a valid impulse + potential retest.
📈 Key Levels
🟢 Resistance
74,750 – very strong resistance (currently being tested)
77,100
79,000 – macro resistance
🔴 Support
71,300 – fresh support
69,740
67,050 – very strong
Most important level now:
👉 71,300
If maintained, the uptrend continues.
📉 Indicators
Stoch RSI
is high (overbought)
A short pullback is possible
This is normal after such an impulse.
MACD
Fresh bullish crossover
The histogram is rising
Momentum is rising
This usually means a few more bullish candles remain.
📊 Volume
The breakout showed:
📈 high volume
This is important because:
the breakout is real
does not look like a fake breakout
🔮 Scenarios
🟢 Bullish (more likely)
Pullback to:
71.3k – 72k
and beyond:
🎯 74.7k → 77k → 79k
🟡 Consolidation
The price could box:
71k – 75k
for a few days before moving higher.
🔴 Bearish (only after a break)
If it drops below:
69,700
then possible:
67k
65k
But there is no bearish signal yet.
🧠 The most important thing that happened
This is key:
👉 BTC has broken out of a downtrend
meaning:
the structure is changing to bullish
the next leg of growth is possible
⭐ My conclusion
Short-term:
📉 a small pullback is possible
Medium-term:
📈 77k – 79k is realistic

Declinazione di responsabilità
Le informazioni e le pubblicazioni non sono intese come, e non costituiscono, consulenza o raccomandazioni finanziarie, di investimento, di trading o di altro tipo fornite o approvate da TradingView. Per ulteriori informazioni, consultare i Termini di utilizzo.
Declinazione di responsabilità
Le informazioni e le pubblicazioni non sono intese come, e non costituiscono, consulenza o raccomandazioni finanziarie, di investimento, di trading o di altro tipo fornite o approvate da TradingView. Per ulteriori informazioni, consultare i Termini di utilizzo.