
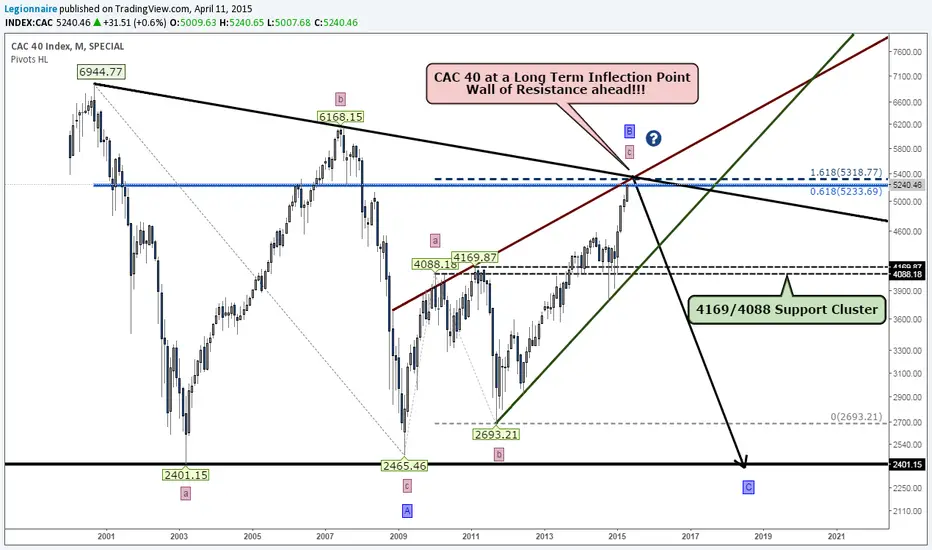
Looking at the Monthly chart of the CAC40 you can clearly see its heading into a Wall of Resistance. Fibonacci cluster, LT T-Line Resistance, Wedge Resistance and Price resistance. This is the real test for the CAC40 bulls. Clearly the bulls have the QE wind in their sails but it is PARAMOUNT that they confidently clear the Brick Wall. Tentative Elliott Wave Count on the chart suggests that this is an ideal end of wave target for a Wave C of B (Cycle degree). Definitely one to watch as the DAX (another major beneficiary of QE) is looking to be completing a Wave 5 of C count as well.

Declinazione di responsabilità
Le informazioni e le pubblicazioni non sono intese come, e non costituiscono, consulenza o raccomandazioni finanziarie, di investimento, di trading o di altro tipo fornite o approvate da TradingView. Per ulteriori informazioni, consultare i Termini di utilizzo.
Declinazione di responsabilità
Le informazioni e le pubblicazioni non sono intese come, e non costituiscono, consulenza o raccomandazioni finanziarie, di investimento, di trading o di altro tipo fornite o approvate da TradingView. Per ulteriori informazioni, consultare i Termini di utilizzo.