

Hi Traders
CAD/CHF Multi-Timeframe analysis
H1 CHART ( BULLISH )
A very high probability, entry signal to go LONG was given at 0.71104 after the market found support at 0.70829 . Only the downward break of 0.70829 would cancel the bullish scenario.
Support & Resistances
0.70789 0.71094
0.70455 0.71331
0.70165 0.71621
H4 CHART ( BULLISH )
A very high probability, entry signal to go LONG was given at 0.71104 after the market found support at 0.70829 . Only the downward break of 0.70829 would cancel the bullish scenario.
Support & Resistances
0.70789 0.71094
0.70455 0.71331
0.70293 0.71621
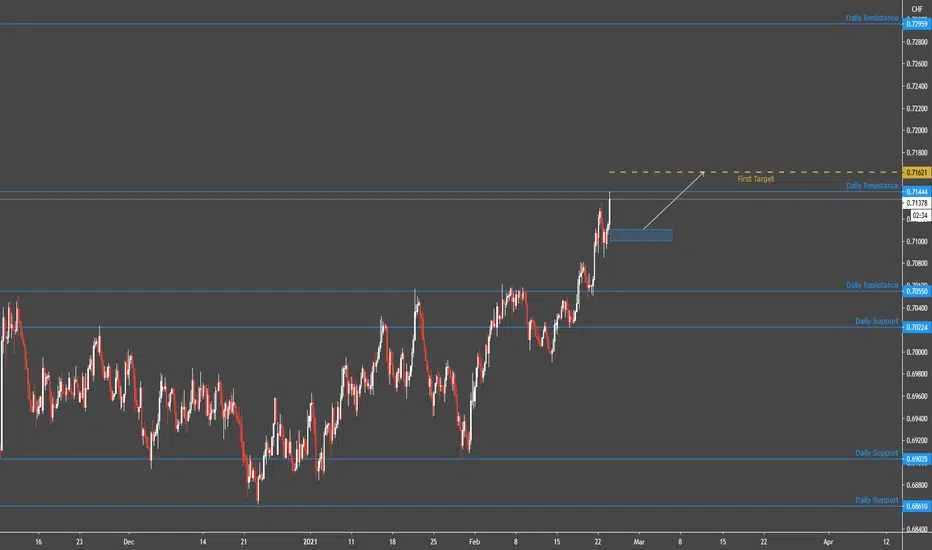
DAILY CHART ( BULLISH )
A medium probability, entry signal to go LONG was given at 0.70611 after the market broke the resistance level at 0.70611 .
Support & Resistances
0.70224 0.70550
0.69035 0.71444
0.68610 0.72959
WEEKLY CHART ( BULLISH )
Waiting for a retracement lower towards the 0.70070 support level, in order to reinstate LONG positions. Next important support is the 0.68165 level.
Support & Resistances
0.70070 0.71194
0.68165 0.72008
0.67449 0.72512
CAD/CHF Multi-Timeframe analysis
H1 CHART ( BULLISH )
A very high probability, entry signal to go LONG was given at 0.71104 after the market found support at 0.70829 . Only the downward break of 0.70829 would cancel the bullish scenario.
Support & Resistances
0.70789 0.71094
0.70455 0.71331
0.70165 0.71621
H4 CHART ( BULLISH )
A very high probability, entry signal to go LONG was given at 0.71104 after the market found support at 0.70829 . Only the downward break of 0.70829 would cancel the bullish scenario.
Support & Resistances
0.70789 0.71094
0.70455 0.71331
0.70293 0.71621
DAILY CHART ( BULLISH )
A medium probability, entry signal to go LONG was given at 0.70611 after the market broke the resistance level at 0.70611 .
Support & Resistances
0.70224 0.70550
0.69035 0.71444
0.68610 0.72959
WEEKLY CHART ( BULLISH )
Waiting for a retracement lower towards the 0.70070 support level, in order to reinstate LONG positions. Next important support is the 0.68165 level.
Support & Resistances
0.70070 0.71194
0.68165 0.72008
0.67449 0.72512

GET MY FREE EDUCATION HERE:
bit.ly/3pQudRX
bit.ly/3pQudRX
Declinazione di responsabilità
Le informazioni e le pubblicazioni non sono intese come, e non costituiscono, consulenza o raccomandazioni finanziarie, di investimento, di trading o di altro tipo fornite o approvate da TradingView. Per ulteriori informazioni, consultare i Termini di utilizzo.
GET MY FREE EDUCATION HERE:
bit.ly/3pQudRX
bit.ly/3pQudRX
Declinazione di responsabilità
Le informazioni e le pubblicazioni non sono intese come, e non costituiscono, consulenza o raccomandazioni finanziarie, di investimento, di trading o di altro tipo fornite o approvate da TradingView. Per ulteriori informazioni, consultare i Termini di utilizzo.