

📌 Overview
___________________________________________________________
📘 Definition
___________________________________________________________
📌 Key Points
___________________________________________________________
📊 Chart Explanation
___________________________________________________________
📉 Summary
___________________________________________________________
💡 Why It Matters
___________________________________________________________
📌 Conclusion
___________________________________________________________
⚠️ Disclaimer
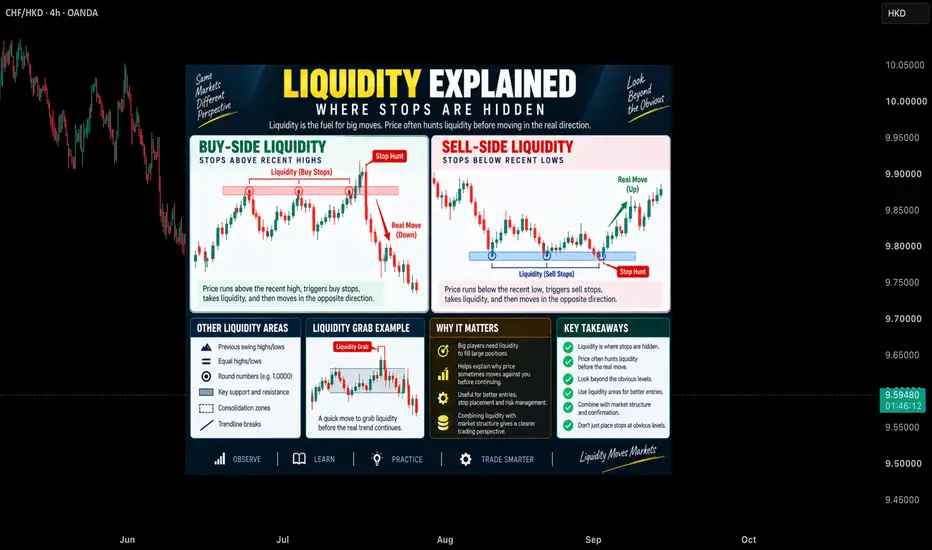
Liquidity refers to areas in the market where a large number of pending orders and stop-losses are concentrated. These zones often attract price because market participants seek liquidity to execute orders efficiently. This educational infographic explains Buy-Side Liquidity, Sell-Side Liquidity, Liquidity Grabs, and why understanding liquidity can help traders better interpret market behavior.
___________________________________________________________
📘 Definition
Liquidity is the availability of orders in the market that allows transactions to occur efficiently. In technical analysis, liquidity is commonly found around previous highs, previous lows, equal highs, equal lows, support, resistance, and other obvious price levels.
- Buy-Side Liquidity – Areas above recent highs where buy stop orders and short-seller stop-losses may accumulate.
- Sell-Side Liquidity – Areas below recent lows where sell stop orders and long-position stop-losses may accumulate.
- Liquidity Grab – A temporary move into a liquidity zone where price collects available orders before potentially moving in another direction.
- Stop Hunt – A market movement that reaches areas where many stop-loss orders are clustered.
- Liquidity Zone – A price area where a significant number of orders are expected to be located.
- Market Participants – Traders and institutions whose orders contribute to market liquidity.
___________________________________________________________
📌 Key Points
• Liquidity often exists around obvious swing highs and swing lows.
• Price may react strongly when liquidity areas are reached.
• Buy-Side Liquidity is commonly located above previous highs.
• Sell-Side Liquidity is commonly located below previous lows.
• Liquidity Grabs can occur before a larger market movement.
• Liquidity should be combined with market structure and confirmation.
• Liquidity concepts help traders understand price behavior, not predict future outcomes.
___________________________________________________________
📊 Chart Explanation
• The Buy-Side Liquidity example highlights how price can move above recent highs where buy stops may be clustered.
• The Sell-Side Liquidity example shows how price can move below recent lows where sell stops may be located.
• The Liquidity Grab example demonstrates a temporary move into a liquidity zone before a potential market reaction.
• The infographic identifies common liquidity locations including swing highs, swing lows, support, resistance, consolidation zones, and trendline areas.
• The examples are educational illustrations intended to explain liquidity concepts and market mechanics.
___________________________________________________________
📉 Summary
Liquidity is an important concept in market analysis because it helps explain why price frequently reacts around certain levels. Understanding Buy-Side Liquidity, Sell-Side Liquidity, and Liquidity Grabs can provide additional context when studying market structure and price action.
___________________________________________________________
💡 Why It Matters
• Helps identify areas where price may attract order flow.
• Improves understanding of market behavior.
• Explains why price may move beyond obvious levels.
• Encourages traders to look beyond simple support and resistance.
• Supports a more structured approach to market analysis.
• Builds a stronger foundation for learning advanced trading concepts.
___________________________________________________________
📌 Conclusion
Liquidity plays a significant role in how markets move. By understanding where liquidity is commonly located and how price may interact with these areas, traders can develop a deeper understanding of market structure and price action behavior.
___________________________________________________________
⚠️ Disclaimer
📘 For educational purposes only.
🙅 Not SEBI registered.
❌ Not a buy/sell recommendation.
🧠 Purely a learning resource.
📊 Not Financial Advice.

Pine Script Developer • Market Analysis
Declinazione di responsabilità
Le informazioni e le pubblicazioni non sono intese come, e non costituiscono, consulenza o raccomandazioni finanziarie, di investimento, di trading o di altro tipo fornite o approvate da TradingView. Per ulteriori informazioni, consultare i Termini di utilizzo.
Pine Script Developer • Market Analysis
Declinazione di responsabilità
Le informazioni e le pubblicazioni non sono intese come, e non costituiscono, consulenza o raccomandazioni finanziarie, di investimento, di trading o di altro tipo fornite o approvate da TradingView. Per ulteriori informazioni, consultare i Termini di utilizzo.