
Chart Structure & Market Context
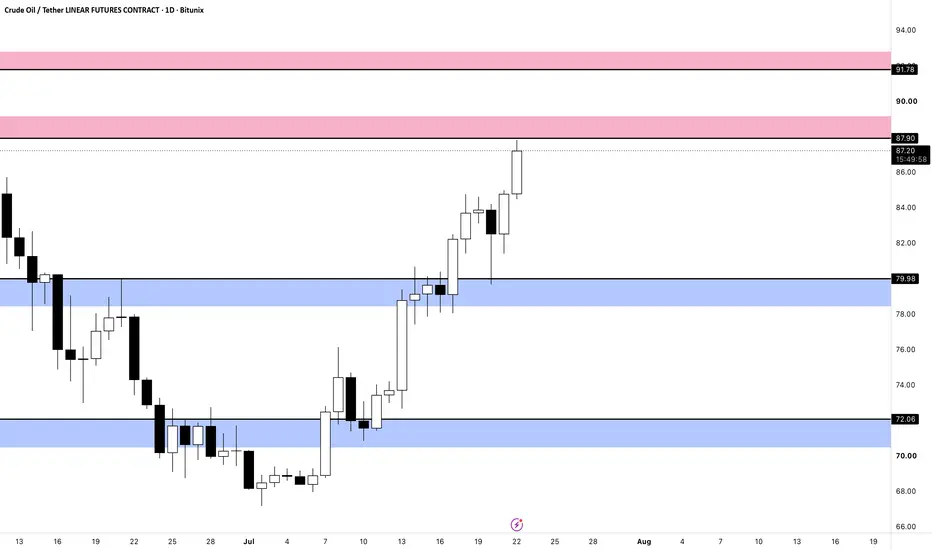
Current Price Action: The chart shows a strong impulse recovery following a sharp multi-week downtrend that bottomed out near the 67-68 support region in early July. Price is currently pushing higher, trading around $86.83, breaking out of its previous consolidation range.
Key Support Zones (Blue Bands):
Lower major support sits around $72.06, where the market established a solid swing base.
Intermediate support/retest zone lies around $79.98, which previously acted as resistance before being flipped into support during the breakout.
Key Resistance Zones (Pink Bands):
Immediate overhead resistance is stacked between $87.90 and $91.78, aligning with prior structural supply where the previous major downtrend originated.
Technical Outlook
Momentum:
The sequence of higher lows and strong bullish daily candles indicates that the short-term path of least resistance has flipped firmly to the upside.
The Test Ahead:
Price is now pressing directly into the lower boundary of the upper resistance zone (~$87.90). How price reacts here will determine whether it can carve a path toward the upper bound of $91.78 or if it will experience a localised pull-back/consolidation to digest recent gains.
Current Price Action: The chart shows a strong impulse recovery following a sharp multi-week downtrend that bottomed out near the 67-68 support region in early July. Price is currently pushing higher, trading around $86.83, breaking out of its previous consolidation range.
Key Support Zones (Blue Bands):
Lower major support sits around $72.06, where the market established a solid swing base.
Intermediate support/retest zone lies around $79.98, which previously acted as resistance before being flipped into support during the breakout.
Key Resistance Zones (Pink Bands):
Immediate overhead resistance is stacked between $87.90 and $91.78, aligning with prior structural supply where the previous major downtrend originated.
Technical Outlook
Momentum:
The sequence of higher lows and strong bullish daily candles indicates that the short-term path of least resistance has flipped firmly to the upside.
The Test Ahead:
Price is now pressing directly into the lower boundary of the upper resistance zone (~$87.90). How price reacts here will determine whether it can carve a path toward the upper bound of $91.78 or if it will experience a localised pull-back/consolidation to digest recent gains.

Declinazione di responsabilità
Le informazioni e le pubblicazioni non sono intese come, e non costituiscono, consulenza o raccomandazioni finanziarie, di investimento, di trading o di altro tipo fornite o approvate da TradingView. Per ulteriori informazioni, consultare i Termini di utilizzo.
Declinazione di responsabilità
Le informazioni e le pubblicazioni non sono intese come, e non costituiscono, consulenza o raccomandazioni finanziarie, di investimento, di trading o di altro tipo fornite o approvate da TradingView. Per ulteriori informazioni, consultare i Termini di utilizzo.