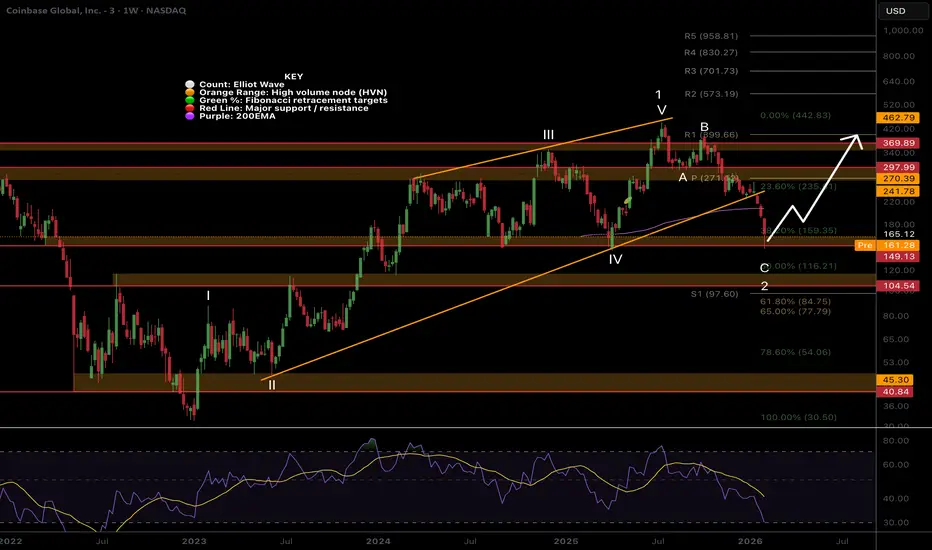
 COIN has a larger sell off then expected completely falling out of its rising wedge. This suggests that the top was a wave 1, completing 5 wave ups diminishing with wave V, with a poke above all time high, IPO launch.
The Elliot wave count is textbook. Wave C of 2 looks to have complete 5 waves down, just below the weekly 200EMA at the major High Volume Node support, 0.382 Fibonacci retracement. While the trend remains down and below the weekly pivot I think Friday was a capitulation event and we move up from here. Theres always a sweep of the lows possible first.
Friday closed at the daily candle high, showing investor confidence to hold over the weekend news and BTC price cycle.
Weekly RSI is tapping oversold, with slight hidden bullish divergence.
Safe trading

🎓 Behavioural Economist (PhD)
📈 Trader / Investor 15 years
👑 Unlock my trading plans: tradingblueprints.substack.com
🏆 Market Psychologist Newsletter: marketpsychologist.substack.com
📈 Trader / Investor 15 years
👑 Unlock my trading plans: tradingblueprints.substack.com
🏆 Market Psychologist Newsletter: marketpsychologist.substack.com
Pubblicazioni correlate
Declinazione di responsabilità
Le informazioni e le pubblicazioni non sono intese come, e non costituiscono, consulenza o raccomandazioni finanziarie, di investimento, di trading o di altro tipo fornite o approvate da TradingView. Per ulteriori informazioni, consultare i Termini di utilizzo.
🎓 Behavioural Economist (PhD)
📈 Trader / Investor 15 years
👑 Unlock my trading plans: tradingblueprints.substack.com
🏆 Market Psychologist Newsletter: marketpsychologist.substack.com
📈 Trader / Investor 15 years
👑 Unlock my trading plans: tradingblueprints.substack.com
🏆 Market Psychologist Newsletter: marketpsychologist.substack.com
Pubblicazioni correlate
Declinazione di responsabilità
Le informazioni e le pubblicazioni non sono intese come, e non costituiscono, consulenza o raccomandazioni finanziarie, di investimento, di trading o di altro tipo fornite o approvate da TradingView. Per ulteriori informazioni, consultare i Termini di utilizzo.