
Why Most Traders Lose: They Trade on 1 Confirmation
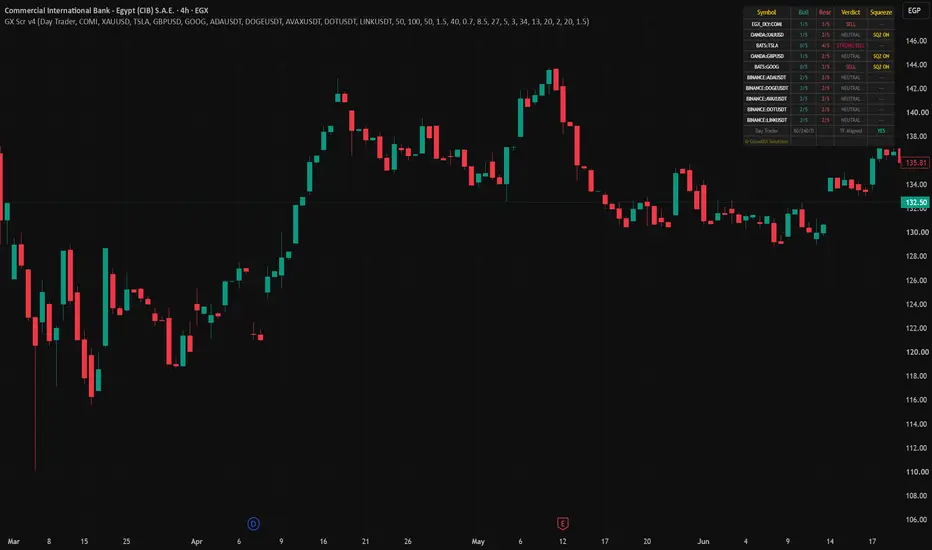
█ THE PROBLEM: Single-Indicator Trading
Here's a hard truth most traders don't want to hear:
If you're entering trades based on ONE indicator — you're not trading. You're gambling with extra steps.
• RSI hits 70 → you short. Price keeps going up.
• MACD crosses bullish → you buy. Market reverses immediately.
• EMA crossover → you enter. It was a fakeout.
Sound familiar?
The issue isn't the indicator. The issue is that NO single indicator was designed to work alone. Each one measures ONE dimension of the market. But the market is multi-dimensional.
█ THE DATA
Let's look at what happens when you rely on single confirmations:
• RSI alone: ~45% win rate in trending markets (it stays overbought for weeks)
• MACD alone: ~50% win rate (lags significantly, late entries)
• EMA cross alone: ~40% win rate in choppy markets (constant whipsaws)
Now compare that to what happens when you STACK independent confirmations:
• 3 layers agreeing: ~60-65% win rate
• 4 layers agreeing: ~70-75% win rate
• 5 layers agreeing: ~80%+ win rate (rare signals, but high probability)
This isn't magic. It's basic probability. When 5 independent conditions must ALL be true simultaneously, the chance of a false signal drops exponentially.
█ THE 5 LAYERS THAT MATTER
After years of testing, these are the 5 independent dimensions that matter most:
1. TREND — Are the EMAs properly stacked? Is there a clear direction?
2. MOMENTUM — Is RSI confirming the move? Not just "overbought/oversold" but actually aligned with direction.
3. MOMENTUM SHIFT — Is the MACD histogram GROWING? Not just positive — accelerating. This is the difference between a dying trend and a fresh one.
4. VOLUME — Is money actually behind this move? A breakout without volume is a trap. Period.
5. VOLATILITY — Is the market actually moving? ATR expanding means opportunity. ATR contracting means stay out.
█ WHY THIS WORKS
Each layer measures something DIFFERENT:
• Layer 1 = Direction
• Layer 2 = Strength
• Layer 3 = Acceleration
• Layer 4 = Participation
• Layer 5 = Environment
When all 5 agree, you're not just seeing a signal. You're seeing:
→ The market is trending (direction)
→ With momentum behind it (strength)
→ That momentum is increasing (acceleration)
→ With real money participating (volume)
→ In an active market environment (volatility)
That's not a "maybe." That's a high-probability setup.
█ PRACTICAL APPLICATION
Here's how to use this framework:
Step 1: Check the trend (EMA alignment)
Step 2: Confirm momentum (RSI above/below 50)
Step 3: Look for acceleration (MACD histogram growing)
Step 4: Verify volume (above average on signal candle)
Step 5: Confirm volatility (ATR expanding)
Score: Count how many layers agree.
• 5/5 → High conviction entry
• 4/5 → Standard entry
• 3/5 → Watch list only
• 2/5 or less → No trade. Walk away.
The hardest part isn't the system. It's having the discipline to WAIT for 4-5 layers to align instead of jumping in on 1-2.
█ THE MINDSET SHIFT
Stop asking: "Is this indicator giving me a signal?"
Start asking: "How many independent confirmations do I have?"
One confirmation = opinion.
Five confirmations = evidence.
Trade evidence. Not opinions.
█ KEY TAKEAWAYS
1. No single indicator works reliably alone — they were never designed to
2. Stacking 4-5 independent layers dramatically improves win rate
3. Each layer must measure something DIFFERENT (don't stack 3 momentum indicators)
4. Fewer trades + higher probability = more profit than many trades + low probability
5. The discipline to wait for confluence is what separates professionals from gamblers
Here's a hard truth most traders don't want to hear:
If you're entering trades based on ONE indicator — you're not trading. You're gambling with extra steps.
• RSI hits 70 → you short. Price keeps going up.
• MACD crosses bullish → you buy. Market reverses immediately.
• EMA crossover → you enter. It was a fakeout.
Sound familiar?
The issue isn't the indicator. The issue is that NO single indicator was designed to work alone. Each one measures ONE dimension of the market. But the market is multi-dimensional.
█ THE DATA
Let's look at what happens when you rely on single confirmations:
• RSI alone: ~45% win rate in trending markets (it stays overbought for weeks)
• MACD alone: ~50% win rate (lags significantly, late entries)
• EMA cross alone: ~40% win rate in choppy markets (constant whipsaws)
Now compare that to what happens when you STACK independent confirmations:
• 3 layers agreeing: ~60-65% win rate
• 4 layers agreeing: ~70-75% win rate
• 5 layers agreeing: ~80%+ win rate (rare signals, but high probability)
This isn't magic. It's basic probability. When 5 independent conditions must ALL be true simultaneously, the chance of a false signal drops exponentially.
█ THE 5 LAYERS THAT MATTER
After years of testing, these are the 5 independent dimensions that matter most:
1. TREND — Are the EMAs properly stacked? Is there a clear direction?
2. MOMENTUM — Is RSI confirming the move? Not just "overbought/oversold" but actually aligned with direction.
3. MOMENTUM SHIFT — Is the MACD histogram GROWING? Not just positive — accelerating. This is the difference between a dying trend and a fresh one.
4. VOLUME — Is money actually behind this move? A breakout without volume is a trap. Period.
5. VOLATILITY — Is the market actually moving? ATR expanding means opportunity. ATR contracting means stay out.
█ WHY THIS WORKS
Each layer measures something DIFFERENT:
• Layer 1 = Direction
• Layer 2 = Strength
• Layer 3 = Acceleration
• Layer 4 = Participation
• Layer 5 = Environment
When all 5 agree, you're not just seeing a signal. You're seeing:
→ The market is trending (direction)
→ With momentum behind it (strength)
→ That momentum is increasing (acceleration)
→ With real money participating (volume)
→ In an active market environment (volatility)
That's not a "maybe." That's a high-probability setup.
█ PRACTICAL APPLICATION
Here's how to use this framework:
Step 1: Check the trend (EMA alignment)
Step 2: Confirm momentum (RSI above/below 50)
Step 3: Look for acceleration (MACD histogram growing)
Step 4: Verify volume (above average on signal candle)
Step 5: Confirm volatility (ATR expanding)
Score: Count how many layers agree.
• 5/5 → High conviction entry
• 4/5 → Standard entry
• 3/5 → Watch list only
• 2/5 or less → No trade. Walk away.
The hardest part isn't the system. It's having the discipline to WAIT for 4-5 layers to align instead of jumping in on 1-2.
█ THE MINDSET SHIFT
Stop asking: "Is this indicator giving me a signal?"
Start asking: "How many independent confirmations do I have?"
One confirmation = opinion.
Five confirmations = evidence.
Trade evidence. Not opinions.
█ KEY TAKEAWAYS
1. No single indicator works reliably alone — they were never designed to
2. Stacking 4-5 independent layers dramatically improves win rate
3. Each layer must measure something DIFFERENT (don't stack 3 momentum indicators)
4. Fewer trades + higher probability = more profit than many trades + low probability
5. The discipline to wait for confluence is what separates professionals from gamblers

Declinazione di responsabilità
Le informazioni e le pubblicazioni non sono intese come, e non costituiscono, consulenza o raccomandazioni finanziarie, di investimento, di trading o di altro tipo fornite o approvate da TradingView. Per ulteriori informazioni, consultare i Termini di utilizzo.
Declinazione di responsabilità
Le informazioni e le pubblicazioni non sono intese come, e non costituiscono, consulenza o raccomandazioni finanziarie, di investimento, di trading o di altro tipo fornite o approvate da TradingView. Per ulteriori informazioni, consultare i Termini di utilizzo.