
Introduction to the Setup
In this educational post, we will discover a low-risk bullish reversal setup,
We all know that markets are dynamic & getting more and more efficient, and in such conditions, we also need to take a dynamic approach to the markets in different situations, you can't have a edge if you stick to only one setup in every market situation. For Example If you are a breakout trader then you will only look range breakouts but the current market situation is kind of end phase of A correction. So there you won't find stocks with good ranges building up for breakout At that point You either will have bad entries or either you need to wait for the range to build.
But here let's say you have another setup of reversal trading then you can find many good entries with low risk.
This setup a combination of price action and moving averages, Let's explore great setup in detail.
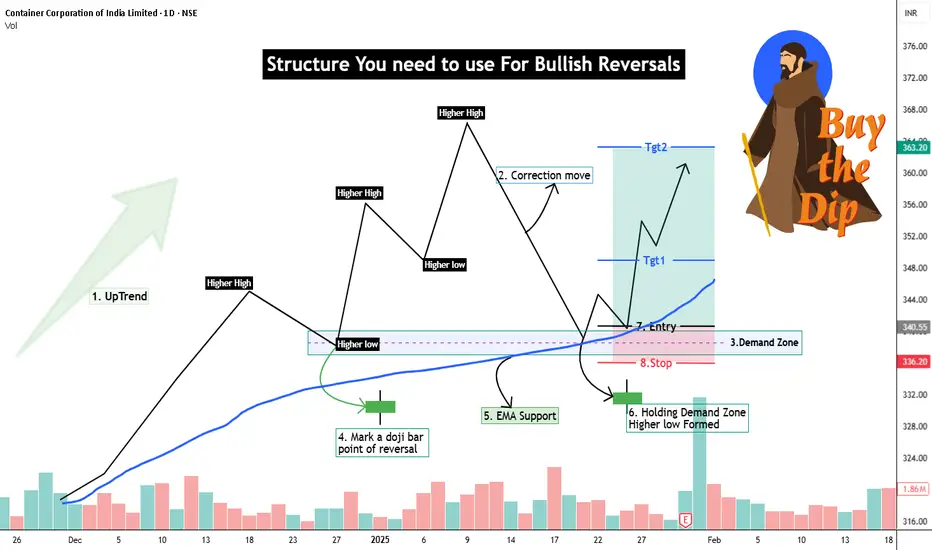
1. You need to identify the The trend
👉🏻Market was already in an uptrend.
👉🏻Higher highs and higher lows were present earlier.
Once you have identified a uptrend then you are ready to move to the second step.
2. Correction Phase – Healthy Pullback, Not Breakdown
👉🏻Price made a deep correction from the top.
👉🏻This correction came into the EMA support area.
👉🏻No panic selling, no long red candles exploding downward.
A correction should show signs of weakness when it reaches into 3rd step.
3. The Demand Zone
👉🏻 You need to find a area on the left side of chart (in uptrend) from where Massive up move has started.
👉🏻 On the chart you will find we have marked a rectangle box in blue color starting from the previous higher area, From this point the price has good up move Hence it's a demand zone.
👉🏻 When falling price reaches this area the price should react
by giving wicks from below in a candle or the size falling candle should reduce or some indecision candle form like Doji, spinning top etc.
4. Demand Zone Marking
👉 On the higher low you area you will find range candle just before the upmove bursts so that candle is used to mark the demand zone
5.EMA + Demand Zone = Support Cluster
👉Price reacts exactly where EMA support and demand zone overlap.
👉This zone is where buyers previously stepped in.
👉Market is basically saying: “This area still matters.”
⭐️ One support is weak. Multiple supports together are strong.
6. Holding demand zone
👉🏻After touching demand, price does NOT make a lower low.
👉🏻Instead, it forms a higher low.
👉🏻This is the first real signal that sellers are losing control.
7. Entry Action
👉🏻 Usually when the price hit demand zone and it forms few bullish candles, it tries to retest the demand zone once again but this time it reverses a little above from demand zone at that time you need to act and place your buys.
8. Setting The Stoploss
👉🏻 The stop loss is below the demand zone, If the demand zone fails to hold the prize then you will get a very early exit, Usually these kind of entries have 1% to 2% of stop loss because we do not want to trade any demand zone which is bigger than 2%
9. The Reward
👉🏻 In a reversal setup you at least need to maintain 1:2 risk to reward ratio.
👉🏻 Pay attention last Higher High Zone From where this correction has started That point will be called as a supply zone and there also you will find range bar just the starting of down move so that supply zone is the maximum target that you need to aim for.
👉🏻 Make sure that the last supply zone is not too near from your entry you need to give price some room to make movements.
Practice Time - With Live Examples🗒

This is TVS motor 1h chart and we have applied a 200 EMA.
First you will find a very good uptrend then a pullback that has stopped for the first time just above 200 EMA and then it gave a very good high making new swing high then it corrected down into the last reversal area which we have marked as a demand zone and there 200 EMA is also acting as a support so we have a very good cluster of supports there,
At that time you will strike and place your buy orders.
I hope you have a good Clarity on this Setup, simple and actionable with a good price action understanding.
Hit the Boost Button & Comment down your Doubts, Queries and ideas
Keep Learning,
Happy Trading.
In this educational post, we will discover a low-risk bullish reversal setup,
We all know that markets are dynamic & getting more and more efficient, and in such conditions, we also need to take a dynamic approach to the markets in different situations, you can't have a edge if you stick to only one setup in every market situation. For Example If you are a breakout trader then you will only look range breakouts but the current market situation is kind of end phase of A correction. So there you won't find stocks with good ranges building up for breakout At that point You either will have bad entries or either you need to wait for the range to build.
But here let's say you have another setup of reversal trading then you can find many good entries with low risk.
This setup a combination of price action and moving averages, Let's explore great setup in detail.
1. You need to identify the The trend
👉🏻Market was already in an uptrend.
👉🏻Higher highs and higher lows were present earlier.
Once you have identified a uptrend then you are ready to move to the second step.
2. Correction Phase – Healthy Pullback, Not Breakdown
👉🏻Price made a deep correction from the top.
👉🏻This correction came into the EMA support area.
👉🏻No panic selling, no long red candles exploding downward.
A correction should show signs of weakness when it reaches into 3rd step.
3. The Demand Zone
👉🏻 You need to find a area on the left side of chart (in uptrend) from where Massive up move has started.
👉🏻 On the chart you will find we have marked a rectangle box in blue color starting from the previous higher area, From this point the price has good up move Hence it's a demand zone.
👉🏻 When falling price reaches this area the price should react
by giving wicks from below in a candle or the size falling candle should reduce or some indecision candle form like Doji, spinning top etc.
4. Demand Zone Marking
👉 On the higher low you area you will find range candle just before the upmove bursts so that candle is used to mark the demand zone
5.EMA + Demand Zone = Support Cluster
👉Price reacts exactly where EMA support and demand zone overlap.
👉This zone is where buyers previously stepped in.
👉Market is basically saying: “This area still matters.”
⭐️ One support is weak. Multiple supports together are strong.
6. Holding demand zone
👉🏻After touching demand, price does NOT make a lower low.
👉🏻Instead, it forms a higher low.
👉🏻This is the first real signal that sellers are losing control.
7. Entry Action
👉🏻 Usually when the price hit demand zone and it forms few bullish candles, it tries to retest the demand zone once again but this time it reverses a little above from demand zone at that time you need to act and place your buys.
8. Setting The Stoploss
👉🏻 The stop loss is below the demand zone, If the demand zone fails to hold the prize then you will get a very early exit, Usually these kind of entries have 1% to 2% of stop loss because we do not want to trade any demand zone which is bigger than 2%
9. The Reward
👉🏻 In a reversal setup you at least need to maintain 1:2 risk to reward ratio.
👉🏻 Pay attention last Higher High Zone From where this correction has started That point will be called as a supply zone and there also you will find range bar just the starting of down move so that supply zone is the maximum target that you need to aim for.
👉🏻 Make sure that the last supply zone is not too near from your entry you need to give price some room to make movements.
Practice Time - With Live Examples🗒
This is
TVS motor 1h chart and we have applied a 200 EMA.First you will find a very good uptrend then a pullback that has stopped for the first time just above 200 EMA and then it gave a very good high making new swing high then it corrected down into the last reversal area which we have marked as a demand zone and there 200 EMA is also acting as a support so we have a very good cluster of supports there,
At that time you will strike and place your buy orders.
I hope you have a good Clarity on this Setup, simple and actionable with a good price action understanding.
Hit the Boost Button & Comment down your Doubts, Queries and ideas
Keep Learning,
Happy Trading.

Pubblicazioni correlate
Declinazione di responsabilità
Le informazioni e le pubblicazioni non sono intese come, e non costituiscono, consulenza o raccomandazioni finanziarie, di investimento, di trading o di altro tipo fornite o approvate da TradingView. Per ulteriori informazioni, consultare i Termini di utilizzo.
Pubblicazioni correlate
Declinazione di responsabilità
Le informazioni e le pubblicazioni non sono intese come, e non costituiscono, consulenza o raccomandazioni finanziarie, di investimento, di trading o di altro tipo fornite o approvate da TradingView. Per ulteriori informazioni, consultare i Termini di utilizzo.