
1. Market Context
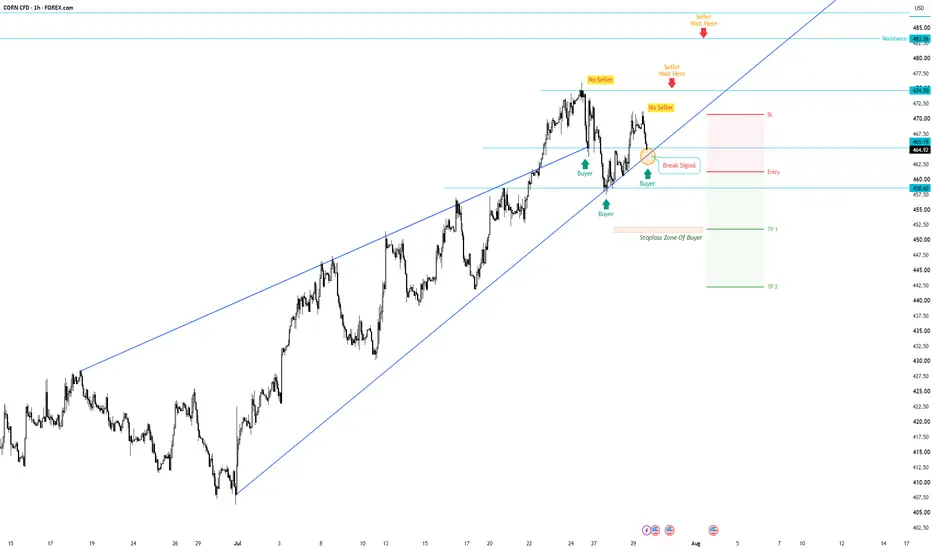
On the 1H chart, Corn is trading along a major ascending trendline within an up-channel. The price recently formed a lower high near 471.00 and is now testing the trendline support around 464.92. We wait for a confirmed trendline breakdown to trigger a short setup.
2. Casino / House Trap Analysis
• The Trendline Buyer Trap: Retail traders keep buying every touch of the ascending trendline ("Buyer"), believing the uptrend will continue. They have stacked a thick layer of stop-loss orders in the "Stoploss Zone Of Buyer" below 452.50.
• Peak Exhaustion ("No Seller"): After failing to reach the major resistance at 474.70 ("Seller Wait Here"), the recent bounce stalled out early ("No Seller"), showing that buyers are losing power to push price higher.
• Breakdown Cascade: A 1H candle close below the trendline and 461.00 support ("Break Signal") will officially trigger the House's trap. The forced liquidation of trapped buyers will become fuel, driving price down rapidly to sweep the buyer stop-loss pool.
3. Trade Setup
• Entry: 461.00 (Confirmed 1H close below trendline support / Break Signal)
• Stop Loss (SL): 471.00 (Placed above the recent "No Seller" bounce high)
• Take Profit 1 (TP1): 451.00 (Targeting the "Stoploss Zone Of Buyer")
• Take Profit 2 (TP2): 442.50 (Deeper structural support level)
• Risk-to-Reward Ratio (R:R): Approx 2:1 (Calculated toward TP2)
On the 1H chart, Corn is trading along a major ascending trendline within an up-channel. The price recently formed a lower high near 471.00 and is now testing the trendline support around 464.92. We wait for a confirmed trendline breakdown to trigger a short setup.
2. Casino / House Trap Analysis
• The Trendline Buyer Trap: Retail traders keep buying every touch of the ascending trendline ("Buyer"), believing the uptrend will continue. They have stacked a thick layer of stop-loss orders in the "Stoploss Zone Of Buyer" below 452.50.
• Peak Exhaustion ("No Seller"): After failing to reach the major resistance at 474.70 ("Seller Wait Here"), the recent bounce stalled out early ("No Seller"), showing that buyers are losing power to push price higher.
• Breakdown Cascade: A 1H candle close below the trendline and 461.00 support ("Break Signal") will officially trigger the House's trap. The forced liquidation of trapped buyers will become fuel, driving price down rapidly to sweep the buyer stop-loss pool.
3. Trade Setup
• Entry: 461.00 (Confirmed 1H close below trendline support / Break Signal)
• Stop Loss (SL): 471.00 (Placed above the recent "No Seller" bounce high)
• Take Profit 1 (TP1): 451.00 (Targeting the "Stoploss Zone Of Buyer")
• Take Profit 2 (TP2): 442.50 (Deeper structural support level)
• Risk-to-Reward Ratio (R:R): Approx 2:1 (Calculated toward TP2)
Trade attivo
Trade chiuso manualmente

Declinazione di responsabilità
Le informazioni e le pubblicazioni non sono intese come, e non costituiscono, consulenza o raccomandazioni finanziarie, di investimento, di trading o di altro tipo fornite o approvate da TradingView. Per ulteriori informazioni, consultare i Termini di utilizzo.
Declinazione di responsabilità
Le informazioni e le pubblicazioni non sono intese come, e non costituiscono, consulenza o raccomandazioni finanziarie, di investimento, di trading o di altro tipo fornite o approvate da TradingView. Per ulteriori informazioni, consultare i Termini di utilizzo.