
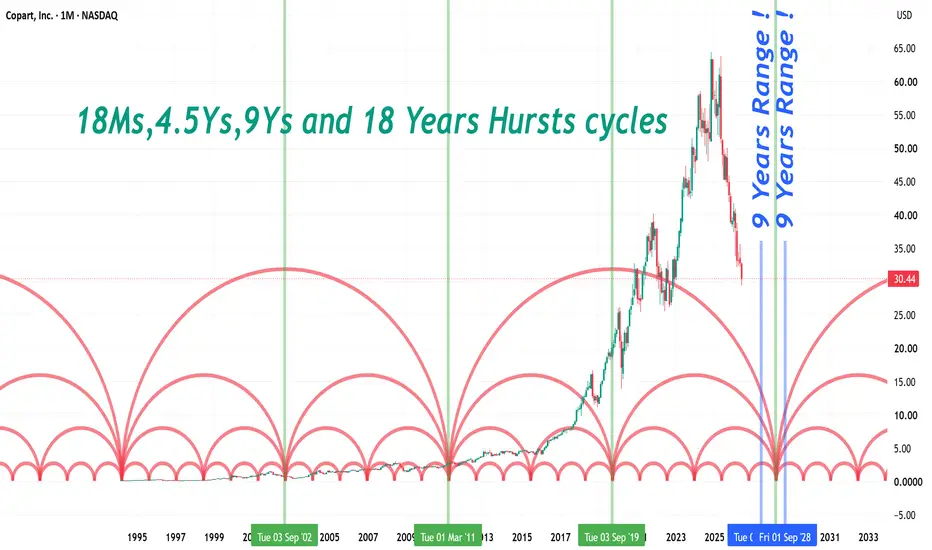
Ai answer:
" Hurst Cycles utilize a framework of harmonically linked time frames based on the Hurst Nominal Model, where larger cycles are roughly double the length of smaller ones. These cycles are analyzed across three main tiers of market activity:Macro to Standard Cycles (Daily/Weekly Charts)These are the foundational cycle lengths J.M. Hurst originally identified from U.S. stock market data.18-Year Cycle: Average of 17.93 years.4.5-Year Cycle: Roughly 54-56 months.18-Month Cycle: Average of 17.93 months.40-Week Cycle: Roughly 273 days.20-Week Cycle: Roughly 136 days (often used as the foundational baseline cycles "
" Hurst Cycles utilize a framework of harmonically linked time frames based on the Hurst Nominal Model, where larger cycles are roughly double the length of smaller ones. These cycles are analyzed across three main tiers of market activity:Macro to Standard Cycles (Daily/Weekly Charts)These are the foundational cycle lengths J.M. Hurst originally identified from U.S. stock market data.18-Year Cycle: Average of 17.93 years.4.5-Year Cycle: Roughly 54-56 months.18-Month Cycle: Average of 17.93 months.40-Week Cycle: Roughly 273 days.20-Week Cycle: Roughly 136 days (often used as the foundational baseline cycles "
Trade attivo
Trade chiuso: obiettivo raggiunto
Nota
Nota
RSI is lowest on record...Nota
Ai analysis for down Trend !1. Market Share Volatility via Resurgent Rivalry Copart operates in a near-duopoly within the U.S.
insurance-salvage channel, but its moat faces tactical challenges.
IAA Resurgence: Copart's primary direct rival, Insurance Auto Auctions (IAA), backed by parent RB Global, has
aggressively targeted Copart's core insurance volume. Volume Attrition: Recent market concerns center on localized
market share losses to IAA as insurers reallocate vehicle supply.Digital Disruptors: Digital-first platforms like ACV
Auctions and OPENLANE present alternative vehicle remarketing avenues, creating geographic pricing pressures.2.
Concentration and Leverage of Major InsurersCopart does not control its own supply loop; it relies heavily on third-
party corporations.Insurer Power: A small handful of large auto insurance carriers supply a vast majority of Copart's
domestic salvage inventory.Negotiating Pressure: Increased competition from IAA allows these mega-insurers to play
both auction houses against each other to lower contract fees.Defection Risk: The loss of even a single major insurance
account to a competitor represents an immediate bottleneck to Copart’s volume growth.3. Alternative Processing and
In-House ExperimentsThe industry is exploring paths that bypass traditional multi-layered salvage yards altogether.In-
House Scrap Operations: Select insurance companies are experimenting with proprietary, in-house vehicle processing
and direct part-out models.Direct-to-Scrap Platforms: Specialized brokers and alternative platforms (such as
AutoBidMaster or SCA Auction) continually attempt to streamline the supply chain directly to end-buyers, bypassing
Copart's fee structures.4. Valuation Premium CompressionCopart historically trades at a premium multiple compared to
broader business services due to its consistent cash flow and high network barriers.Growth Moderation: As growth paces
soften or stabilize, investor exits reflect anxiety that its valuation overestimates future expansion.Margin Vulnerability:
Sustained cost inflation regarding land development, towing, and yard labor directly challenges the company's margin
advantage if pricing power is restricted by competition
Nota
Track Analyst Projections Brokerages and research platforms update their aggregate targets dynamically:High Estimate: $62.00 to $65.00 – Projected by optimistic analysts factoring in the platform’s high pricing power and recovery from structural insurance volume slumps.
Average Estimate: $44.50 – The broader consensus across Wall Street firms evaluating its asset-light auction model.
Low Estimate: $32.00 – Set by cautious analysts who view soft volumes as a long-term issue, keeping the stock near its 52-week lows
Nota
Compare Firm Forecasts and Targets Research Firm / BrokerageAnalyst Sentiment Rating12-Month Price TargetZacks Research Aggressive Bullish / High Forecast$65.00
HSBCBullish$62.00
Jefferies Buy (Target Lowered from $47)$45.00
S&P Global Consensus Broad Market Average$41.44
JP Morgan Neutral / Market Performer$41.00 BairdHold$41.00
Argus Research Hold Not Disclosed
BarclaysSell / Bearish Underperform$32.00
Nota
Volume guys this is for you...Nota
Tech Rating...Nota
Nota
Ai answer:if the stock price of Copart Inc. (NASDAQ: CPRT) trades at $24.66, its Forward P/E ratio would be 15.61x based on the current fiscal year consensus earnings forecast, while its Trailing P/E ratio would sit at 15.32x.
Nota
If the stock price of Copart Inc. (NASDAQ: CPRT) falls to $13.00, its Forward P/E ratio would plummet to 8.23x based on the current fiscal year consensus earnings forecast, while its Trailing P/E ratio would drop to 8.07x.Nota
Nota
Note: Our fibs is form ATL to ATH
Nota
For an ABC counter trend correction, we have reached extremesNota
Nota
Nota
Nota
Confluence of supporting areas, marketing permitting...Nota
Log chart...Nota
Nota
Log is broken, but regular is holding...Nota
Rate of change is as low as 2003Nota
3MsNota
One way to look at it out of so many counts out there. Is this a probability Yes it's just one out of tens of probable paths for this ticker!Nota
Another one for you out of manyNota
Updates incoming...Nota
Nota
Nota
Scary numbers up there ...Nota
Nota
P/B is as low as bulls wants...Nota
P/E and P/S we have had much lower numbers before as shown above...Nota
25-13 is a BIG Fibs numbers to watch as such on the charts above!Nota
Log Chart...Nota
Above we have not broken the Green line since 09, but down here is the "Reqular" chart we have already broken it !Nota
Zoom in, broken Green line...Nota
$24.66 is the "Golden" Ratio for Fibs Retracements since the IPONota
$13.86 is the "Extremes" Ratio for Fibs Retracements since the IPO ! Just to be aware these are "Breakable" numbers !Nota
Ai answer:When a price breaks past the 0.786 (78.6%) Fibonacci retracement level, it typically signals a strong trend continuation
and means the previous market correction is failing.Key Market ImplicationsTrend Reversal Confirmation: The asset is
likely fully reversing its previous trend rather than just experiencing a temporary pullback.Invalidation of Pattern: The
original wave structure is compromised. Traders looking for a bounce at this deep level will capitulate.Targeting 100%
Retracement: The price is highly likely to head toward the start of the entire move (the 1.0 or 100% level).Liquidity
Hunt: Stop-loss orders placed just beyond the 0.786 level are triggered, accelerating the price movement.
Nota
That said, do not think that we will go and break that unless the whole market collapses or the company goes deep loses fundamantally.
Nota

I do more in depth studies of stocks on my twitter account. Hope you would enjoy it there as you are enjoying it here.
****** Past performance is no guarantee of future results***
twitter.com/samitrading1
****** Past performance is no guarantee of future results***
twitter.com/samitrading1
Declinazione di responsabilità
Le informazioni e le pubblicazioni non sono intese come, e non costituiscono, consulenza o raccomandazioni finanziarie, di investimento, di trading o di altro tipo fornite o approvate da TradingView. Per ulteriori informazioni, consultare i Termini di utilizzo.
I do more in depth studies of stocks on my twitter account. Hope you would enjoy it there as you are enjoying it here.
****** Past performance is no guarantee of future results***
twitter.com/samitrading1
****** Past performance is no guarantee of future results***
twitter.com/samitrading1
Declinazione di responsabilità
Le informazioni e le pubblicazioni non sono intese come, e non costituiscono, consulenza o raccomandazioni finanziarie, di investimento, di trading o di altro tipo fornite o approvate da TradingView. Per ulteriori informazioni, consultare i Termini di utilizzo.