
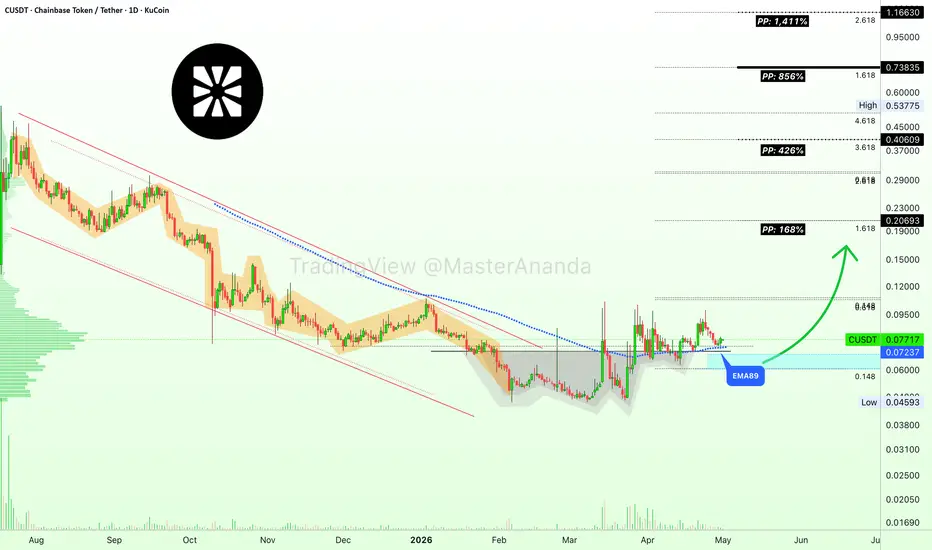
Chainbase has an interesting chart setup with repeating dates, repeating patterns and a chart that implies the altcoins market is transitioning toward a bullish period.
CUSDT. First a downtrend that ends 6-February 2026. The bottom range is first activated 19-January. Only in late March does CUSDT manages to move back above water.
While trading at the bottom, there were several attempts to move above EMA89. 24-Feb with a strong rejection, the session ended with a long wick. 14-March closed above EMA89 but a reversal happened the next day. Then again 24-March until finally, the level broke as resistance on the 27.
Chainbase then went sideways hovering around this level—blue dotted line on the chart. Now trading also above EMA55 which has the same price (not shown on the chart).
Here we can see some bullishness based on these moving averages. If we were to turn off the EMAs, we would still be able to see the liquidity hunt event. CUSDT trading several months below support just to recover. The recovery coupled with rising volume is what reveals incoming change.
A bullish jump would start and end in a flash, an event lasting a few days or weeks at the most. Here we have the bottom process and recovery lasting several months, then CUSDT goes sideways above support and then comes growth. A support base is being built. This base can support an uptrend, long-term growth.
If the bottom and recovery process can last 3 months, a bullish wave can last a minimum of 6 months. After a correction, we get additional growth. Higher highs and higher lows.
Namaste.
CUSDT. First a downtrend that ends 6-February 2026. The bottom range is first activated 19-January. Only in late March does CUSDT manages to move back above water.
While trading at the bottom, there were several attempts to move above EMA89. 24-Feb with a strong rejection, the session ended with a long wick. 14-March closed above EMA89 but a reversal happened the next day. Then again 24-March until finally, the level broke as resistance on the 27.
Chainbase then went sideways hovering around this level—blue dotted line on the chart. Now trading also above EMA55 which has the same price (not shown on the chart).
Here we can see some bullishness based on these moving averages. If we were to turn off the EMAs, we would still be able to see the liquidity hunt event. CUSDT trading several months below support just to recover. The recovery coupled with rising volume is what reveals incoming change.
A bullish jump would start and end in a flash, an event lasting a few days or weeks at the most. Here we have the bottom process and recovery lasting several months, then CUSDT goes sideways above support and then comes growth. A support base is being built. This base can support an uptrend, long-term growth.
If the bottom and recovery process can last 3 months, a bullish wave can last a minimum of 6 months. After a correction, we get additional growth. Higher highs and higher lows.
Namaste.

💯 TOP Results (Sept 2026) 👇
t.me/masteranandatrades/9279
🔥 10-25X Leverage, Results & Profits
t.me/masteranandatrades/9271
✅ 4 PREMIUM Telegram channels special offer
—One-Time Payment! (🔝 since 2017)
t.me/lamatrades/4
t.me/masteranandatrades/9279
🔥 10-25X Leverage, Results & Profits
t.me/masteranandatrades/9271
✅ 4 PREMIUM Telegram channels special offer
—One-Time Payment! (🔝 since 2017)
t.me/lamatrades/4
Pubblicazioni correlate
Declinazione di responsabilità
Le informazioni e le pubblicazioni non sono intese come, e non costituiscono, consulenza o raccomandazioni finanziarie, di investimento, di trading o di altro tipo fornite o approvate da TradingView. Per ulteriori informazioni, consultare i Termini di utilizzo.
💯 TOP Results (Sept 2026) 👇
t.me/masteranandatrades/9279
🔥 10-25X Leverage, Results & Profits
t.me/masteranandatrades/9271
✅ 4 PREMIUM Telegram channels special offer
—One-Time Payment! (🔝 since 2017)
t.me/lamatrades/4
t.me/masteranandatrades/9279
🔥 10-25X Leverage, Results & Profits
t.me/masteranandatrades/9271
✅ 4 PREMIUM Telegram channels special offer
—One-Time Payment! (🔝 since 2017)
t.me/lamatrades/4
Pubblicazioni correlate
Declinazione di responsabilità
Le informazioni e le pubblicazioni non sono intese come, e non costituiscono, consulenza o raccomandazioni finanziarie, di investimento, di trading o di altro tipo fornite o approvate da TradingView. Per ulteriori informazioni, consultare i Termini di utilizzo.