
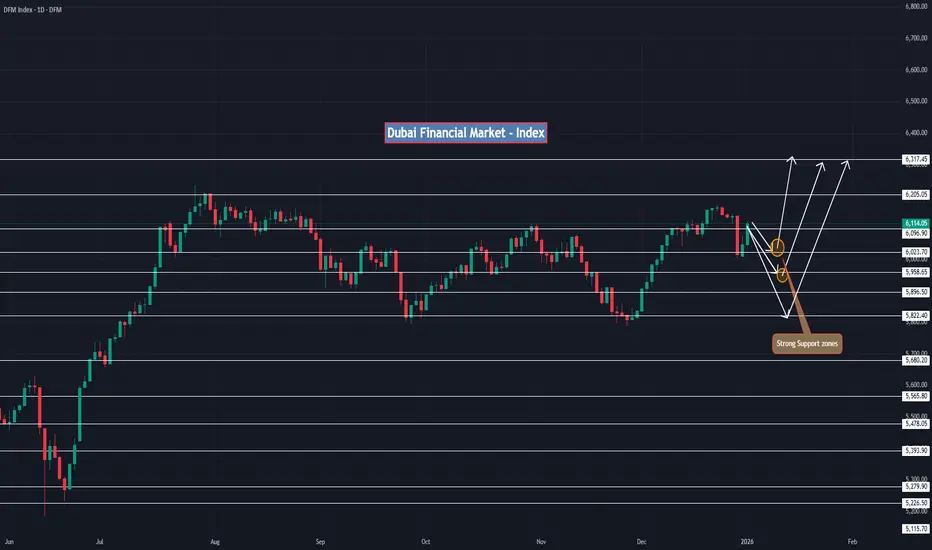
What happened in 2025 (the story of the year)
### 1) Q1 → early Q2: shaky market, then a hard shakeout
* The index chopped early in the year, then **sold off sharply into late March / early April**.
* You can see a **capitulation-style drop with a long lower wick** (panic flush), bottoming around the **4,65x–4,70x zone** (approx).
**Meaning:** weak hands got forced out. This kind of flush often becomes the “year’s major low.”
---
### 2) Q2 → mid Q3: strong trend reversal + powerful rally
* After that April low, DFM did a **V-reversal** and entered a **strong uptrend** (higher highs + higher lows).
* It rallied aggressively all the way to the **6,20x area**, peaking around **6,205–6,25x**.
**Meaning:** this was the “trend year.” Breakouts and buy-the-dip setups worked much better in this phase.
---
### 3) Q3 → Q4: topping behavior + range (distribution)
* From around August onward, price becomes **sideways/choppy** with **lower momentum**.
* The market repeatedly struggled near **6,205** (major resistance), and dips repeatedly found buyers near **5,822** (major support).
* Late November / early December tested the **5,822** support again, then bounced strongly into year-end.
**Meaning:** 2025 ended not in a clean trend, but in a **big range**.
---
## Where we are right now
Latest close shown: **~6,114**.
### Resistance (where sellers have shown up)
* **6,205** (biggest/most important)
* **6,317** (next upside level on your chart)
### Support (where buyers defended)
* **6,023 → 5,958 → 5,896** (stepping-stone supports)
* **5,822** (most important support of the range)
* If 5,822 breaks: **5,680** is the next major “line in the sand”
---
## What to expect in 2026 (3 realistic scenarios)
### Bull case (best for investors + swing traders)
* Index **holds above ~6,023** and **reclaims 6,205** decisively.
* Then probability increases of a push toward **6,317** and potentially higher.
**Confirmation signal:** a clean break above **6,205** + hold (or breakout → retest → bounce).
---
### Range case (most likely if momentum stays mixed)
* Index rotates between **5,822 support** and **6,205 resistance**.
* This is where people get chopped if they chase green candles.
---
### Bear case (if support fails)
* If **5,822 breaks and doesn’t recover quickly**, the market can slide to **5,680** or even lower support zones

Declinazione di responsabilità
Le informazioni e le pubblicazioni non sono intese come, e non costituiscono, consulenza o raccomandazioni finanziarie, di investimento, di trading o di altro tipo fornite o approvate da TradingView. Per ulteriori informazioni, consultare i Termini di utilizzo.
Declinazione di responsabilità
Le informazioni e le pubblicazioni non sono intese come, e non costituiscono, consulenza o raccomandazioni finanziarie, di investimento, di trading o di altro tipo fornite o approvate da TradingView. Per ulteriori informazioni, consultare i Termini di utilizzo.