
DIVISLAB : Running Converging Triangle (ABCDE) Breakout !!!
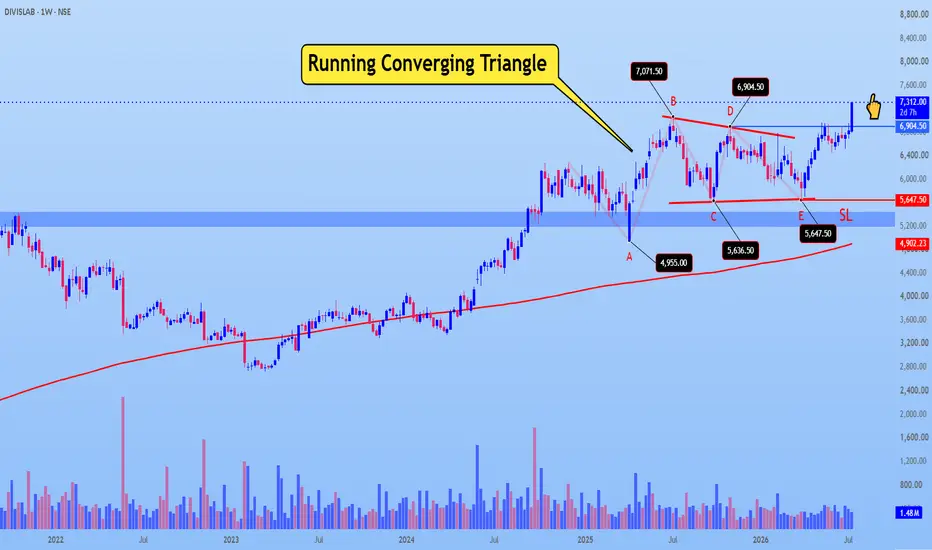
After a strong impulsive rally, DIVISLAB spent several months consolidating in a Running Converging Triangle (A-B-C-D-E).
🔍 Structure Breakdown:
A: Sharp corrective decline after the previous uptrend.
B: Strong recovery, creating the first lower high.
C: Pullback that respected the major demand zone.
D: Another rally, but failed to make a new high, confirming contracting resistance.
E: Final retest of support around ₹5,647, completing the triangle.
Throughout the correction, the stock consistently respected the long-term 200 SMA, indicating that the primary trend remained bullish.
✅ Bullish Confirmation
The price has now broken above the triangle's upper trendline, signaling that the consolidation phase is likely over.
As long as the price sustains above the breakout level, the probability favours the beginning of the next impulsive advance.
📌 Key Levels
Breakout: Above the triangle resistance.
Invalidation / Stop Loss: ₹5,647 (Below Wave E).
Trend Support: 200 SMA remains strongly bullish.
🎯 Elliott Wave Perspective
Running Triangles typically appear as Wave 4 or Wave B corrections. Their purpose is to consume time rather than retrace much of the previous trend. Once complete, they are often followed by a strong directional move in the trend's original direction.
If this interpretation is correct, DIVISLAB could be entering its next impulsive bullish wave.
⚠️ This is an educational Elliott Wave analysis, not financial advice. Always manage your risk and wait for confirmation before taking any trade.
#DIVISLAB #ElliottWave #RunningTriangle #TriangleBreakout #SwingTrading #PositionalTrading #StockMarket #NSE #TechnicalAnalysis #TradingView #PriceAction #WaveAnalysis #Investing #ChartAnalysis #TradingView #Forex #PriceAction #NikhilKanal #iElliottician #IndianEW #EWinHindi #XAUUSD #Gold #ElliottWave
🔍 Structure Breakdown:
A: Sharp corrective decline after the previous uptrend.
B: Strong recovery, creating the first lower high.
C: Pullback that respected the major demand zone.
D: Another rally, but failed to make a new high, confirming contracting resistance.
E: Final retest of support around ₹5,647, completing the triangle.
Throughout the correction, the stock consistently respected the long-term 200 SMA, indicating that the primary trend remained bullish.
✅ Bullish Confirmation
The price has now broken above the triangle's upper trendline, signaling that the consolidation phase is likely over.
As long as the price sustains above the breakout level, the probability favours the beginning of the next impulsive advance.
📌 Key Levels
Breakout: Above the triangle resistance.
Invalidation / Stop Loss: ₹5,647 (Below Wave E).
Trend Support: 200 SMA remains strongly bullish.
🎯 Elliott Wave Perspective
Running Triangles typically appear as Wave 4 or Wave B corrections. Their purpose is to consume time rather than retrace much of the previous trend. Once complete, they are often followed by a strong directional move in the trend's original direction.
If this interpretation is correct, DIVISLAB could be entering its next impulsive bullish wave.
⚠️ This is an educational Elliott Wave analysis, not financial advice. Always manage your risk and wait for confirmation before taking any trade.
#DIVISLAB #ElliottWave #RunningTriangle #TriangleBreakout #SwingTrading #PositionalTrading #StockMarket #NSE #TechnicalAnalysis #TradingView #PriceAction #WaveAnalysis #Investing #ChartAnalysis #TradingView #Forex #PriceAction #NikhilKanal #iElliottician #IndianEW #EWinHindi #XAUUSD #Gold #ElliottWave

Mr. NiKHiL 😎
Declinazione di responsabilità
Le informazioni e le pubblicazioni non sono intese come, e non costituiscono, consulenza o raccomandazioni finanziarie, di investimento, di trading o di altro tipo fornite o approvate da TradingView. Per ulteriori informazioni, consultare i Termini di utilizzo.
Mr. NiKHiL 😎
Declinazione di responsabilità
Le informazioni e le pubblicazioni non sono intese come, e non costituiscono, consulenza o raccomandazioni finanziarie, di investimento, di trading o di altro tipo fornite o approvate da TradingView. Per ulteriori informazioni, consultare i Termini di utilizzo.