
Executive Summary
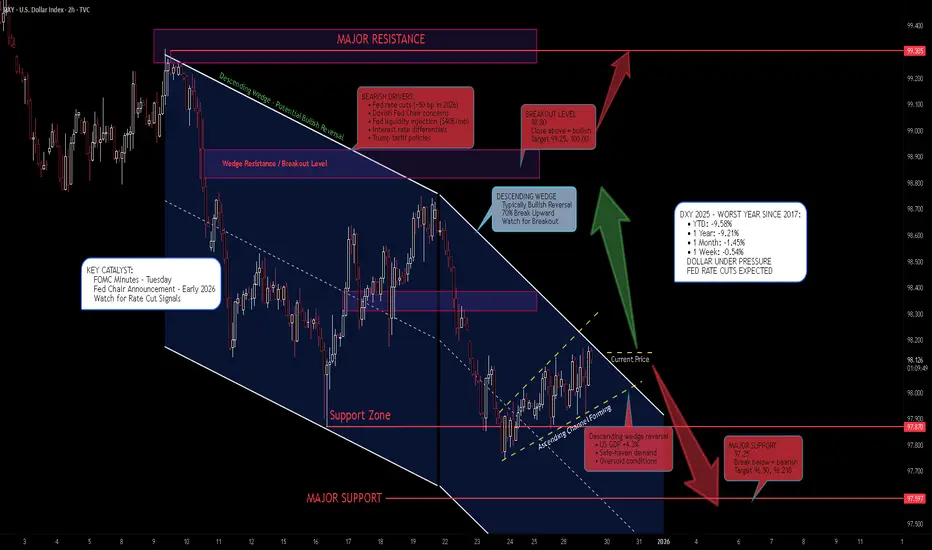
The US Dollar Index (DXY) is trading at 98.130 on December 29, 2025, consolidating within a descending wedge pattern on the 2H timeframe. The Dollar is on track for its worst year since 2017 with -9.58% YTD losses, pressured by Fed rate cut expectations, dovish Fed Chair concerns, and Trump's tariff policies. However, a potential bullish reversal pattern is forming at the bottom of the wedge, with an ascending channel developing. FOMC minutes due Tuesday could be the catalyst for the next directional move.
BIAS: NEUTRAL - Watching for Breakout Direction
The Dollar is at a critical inflection point. The descending wedge suggests potential bullish reversal, but fundamental headwinds remain strong. Wait for confirmation before committing to a direction.
Current Market Context - December 29, 2025
DXY is consolidating near yearly lows:
- Current Price: 98.130 (+0.08% on the day)
- Day's Range: 97.915 - 98.177
- 52-Week Range: 96.218 - 110.176
- 52-Week High: 110.176
- 52-Week Low: 96.218
- Technical Rating: SELL
Performance Metrics - MIXED:
- 1 Week: -0.54%
- 1 Month: -1.45%
- 3 Months: +0.22%
- 6 Months: +1.54%
- YTD: -9.58%
- 1 Year: -9.21%
The Dollar is having its worst year since 2017, down nearly 10% YTD. Short-term metrics are mixed, but the longer-term trend is clearly bearish.
THE BEAR CASE - Dollar Weakness Continues
1. Fed Rate Cut Expectations
The Dollar continues to see underlying weakness as markets price in further rate cuts:
- FOMC expected to cut rates by ~50 bp in 2026
- Markets pricing 19% chance of -25 bp cut at January 27-28 meeting
- Two rate cuts expected in 2026
- Fed officials split on path forward - majority forecast single additional cut
- Lower rates = weaker Dollar
2. Dovish Fed Chair Concerns
- President Trump to announce new Fed Chair in early 2026
- Kevin Hassett (National Economic Council Director) most likely choice
- Hassett seen as most dovish candidate by markets
- Trump wants next Fed chairman to lower rates
- Dovish Fed Chair = bearish for Dollar
3. Fed Liquidity Injection
- Fed began purchasing $40 billion/month in T-bills mid-December
- Announced December 10 - $40 billion/month liquidity injection
- Increased liquidity pressures Dollar lower
- Quantitative easing-like effects
4. Interest Rate Differentials
- FOMC expected to cut rates ~50 bp in 2026
- BOJ expected to raise rates +25 bp in 2026
- ECB expected to leave rates unchanged in 2026
- Narrowing rate differentials = Dollar weakness
- Yen strengthening on BOJ rate hike expectations
5. Trump Tariff Policies
- Aggressive tariff policies pressuring Dollar
- Threats to Fed independence
- Trade tensions creating uncertainty
- Dollar down nearly 10% YTD partly due to tariff concerns
6. Technical Rating: SELL
- TradingView technicals gauge pointing toward "Sell"
- Descending wedge pattern (bearish continuation possible)
- Below major moving averages
- Momentum indicators bearish
THE BULL CASE - Potential Reversal Forming
1. Descending Wedge Pattern (Bullish Reversal)
- Descending wedge is typically a bullish reversal pattern
- Price compressing at bottom of wedge
- Ascending channel forming within wedge
- Potential breakout to upside
- Pattern suggests exhaustion of selling pressure
2. US Economic Data Still Solid
- Q3 GDP came in at +4.3% - stronger than expected
- Nov pending home sales rose +3.3% m/m (vs +0.9% expected)
- Jobless claims unexpectedly fell
- US businesses see employment growth at 4.32%
- Revenue growth expectations at 3.83%
- Strong data could limit Dollar weakness
3. Safe-Haven Demand
- Stock market weakness boosting liquidity demand for Dollar
- Geopolitical tensions (Venezuela blockade, ISIS strikes in Nigeria)
- Ukraine-Russia peace deal uncertainty
- Risk-off events could boost Dollar
4. Oversold Conditions
- Dollar down -9.58% YTD - oversold
- Mean reversion possible
- Near 52-week low (96.218)
- Potential for bounce
5. "US Exceptionalism" Positioning
- BNY's Bob Savage: Rise above 98.15 could trigger momentum buying
- "US exceptionalism positioning" could resurge
- Dollar bulls waiting for catalyst
6. FOMC Minutes Catalyst
- Fed minutes due Tuesday (December 30)
- Could provide signals on rate cut timing
- Hawkish surprise could boost Dollar
- Key catalyst for next move
Technical Structure Analysis
Price Action Overview - 2 Hour Timeframe
The chart shows a complex structure with potential reversal forming:
Descending Wedge Pattern (Primary):
- Clear descending wedge established from highs
- Upper trendline: Falling resistance (connecting lower highs)
- Lower trendline: Falling support (connecting lower lows)
- Wedge narrowing - compression before breakout
- Typically bullish reversal pattern
- Price near apex of wedge
Ascending Channel (Secondary - Forming at Bottom):
- Small ascending channel forming within wedge
- Higher lows being established
- Potential early reversal signal
- Watch for breakout above wedge resistance
Key Zones Identified:
- Upper resistance zone: ~99.25 (major resistance)
- Secondary resistance: ~98.80
- Current consolidation: 97.90-98.20
- Support zone: ~97.85-98.00
- Major support: ~97.25
- 52-Week Low: 96.218
Key Support and Resistance Levels
Resistance Levels:
- 98.177 - Day's high / immediate resistance
- 98.15 - BNY trigger level for momentum buying
- 98.80 - Secondary resistance zone
- 99.00 - Psychological resistance
- 99.25 - Major resistance zone
- 100.00 - MAJOR PSYCHOLOGICAL RESISTANCE
- 110.176 - 52-WEEK HIGH
Support Levels:
- 97.959 - Recent low
- 97.915 - Day's low / immediate support
- 97.85-98.00 - Support zone
- 97.50 - Secondary support
- 97.25 - Major support
- 96.50 - Deep support
- 96.218 - 52-WEEK LOW (critical)
Pattern Analysis
Descending Wedge Characteristics:
- Pattern duration: Several weeks
- Wedge narrowing toward apex
- Volume typically decreases in wedge
- Breakout direction: Usually bullish (70% of cases)
- Target: Measured move = wedge height at breakout
- Current position: Near bottom of wedge
Ascending Channel (Within Wedge):
- Small ascending channel forming
- Higher lows: Bullish sign
- Could be early reversal signal
- Watch for breakout above 98.80
Moving Average Analysis
- Price trading below major moving averages
- MAs sloping downward - bearish alignment
- Short-term MAs below long-term MAs
- Death cross patterns on longer timeframes
- MAs providing dynamic resistance on rallies
SCENARIO ANALYSIS
BULLISH SCENARIO - Descending Wedge Breakout
Trigger Conditions:
- 2H close above 98.80 (wedge resistance)
- Break above 99.00 psychological level
- Volume confirmation on breakout
- FOMC minutes hawkish surprise
- Risk-off sentiment boosting Dollar
Price Targets if Bullish:
- Target 1: 99.25 - Major resistance zone
- Target 2: 100.00 - Psychological level
- Target 3: 101.00-102.00 - Measured move target
- Extended: 103.00+ (trend reversal)
Bullish Catalysts:
- Descending wedge = bullish reversal pattern (70% breakout up)
- Ascending channel forming at bottom
- US economic data still solid (GDP +4.3%)
- Oversold conditions (-9.58% YTD)
- Safe-haven demand potential
- FOMC minutes could be hawkish
- "US exceptionalism" positioning could return
- Mean reversion from extreme weakness
BEARISH SCENARIO - Wedge Breakdown / Continuation
Trigger Conditions:
- Break below 97.25 major support
- Close below 97.00
- FOMC minutes dovish
- Fed signals more aggressive rate cuts
- Dovish Fed Chair announcement
Price Targets if Bearish:
- Target 1: 97.25 - Major support
- Target 2: 96.50 - Deep support
- Target 3: 96.218 - 52-week low
- Extended: 95.00-96.00 (new lows)
Bearish Catalysts:
- -9.58% YTD - Worst year since 2017
- Technical rating: SELL
- Fed rate cuts expected (~50 bp in 2026)
- Dovish Fed Chair concerns (Hassett)
- Fed liquidity injection ($40B/month)
- Interest rate differentials narrowing
- Trump tariff policy uncertainty
- Below major moving averages
NEUTRAL SCENARIO - Consolidation in Range
Most likely short-term outcome:
- Price consolidates between 97.50-98.80
- Thin holiday trading continues
- Wait for FOMC minutes Tuesday
- Wait for Fed Chair announcement
- Wedge pattern continues to compress
- Breakout direction unclear until catalyst
MY ASSESSMENT - NEUTRAL with Slight Bullish Bias
The evidence is mixed, but the technical pattern suggests potential reversal:
Bullish Factors:
- Descending wedge = typically bullish reversal
- Ascending channel forming at bottom
- Oversold conditions (-9.58% YTD)
- US economic data solid
- Safe-haven demand potential
- Near 52-week low (mean reversion)
Bearish Factors:
- Technical rating: SELL
- Fed rate cuts expected
- Dovish Fed Chair concerns
- Fed liquidity injection
- Interest rate differentials narrowing
- Below major moving averages
- Worst year since 2017
My Stance: NEUTRAL - Wait for Confirmation
The descending wedge pattern suggests potential bullish reversal, but fundamental headwinds are strong. The Dollar could go either way from here. Wait for FOMC minutes and a clear breakout before committing.
Strategy:
- Wait for breakout confirmation
- Long above 98.80 with targets 99.25, 100.00
- Short below 97.25 with targets 96.50, 96.218
- Respect the wedge pattern
- FOMC minutes Tuesday = key catalyst
Trade Framework
Scenario 1: Bullish Breakout Trade Above 98.80
Entry Conditions:
- 2H close above 98.80
- Volume confirmation
- Break above descending wedge resistance
Trade Parameters:
Entry: 98.85-99.00 on confirmed breakout
Stop Loss: 98.00 below recent support
Target 1: 99.25 (Risk-Reward ~1:0.5)
Target 2: 100.00 (Risk-Reward ~1:1.2)
Target 3: 101.00-102.00 (Measured move)
Scenario 2: Bearish Breakdown Trade Below 97.25
Entry Conditions:
- 2H close below 97.25
- Volume confirmation
- Break below major support
Trade Parameters:
Entry: 97.20-97.00 on confirmed breakdown
Stop Loss: 97.80 above recent resistance
Target 1: 96.50 (Risk-Reward ~1:1)
Target 2: 96.218 (52-week low)
Target 3: 95.50-96.00 (Extended)
Scenario 3: Range Trade (Neutral)
Entry Conditions:
- Price bounces at 97.50-97.85 support
- Bullish rejection candle
- No breakout yet
Trade Parameters:
Entry: 97.50-97.85 at support
Stop Loss: 97.00 below major support
Target 1: 98.50 (Risk-Reward ~1:1)
Target 2: 98.80 (Wedge resistance)
Risk Management Guidelines
- Position sizing: 1-2% max risk per trade
- Wait for breakout confirmation
- Thin holiday volumes = wider stops
- FOMC minutes Tuesday = key catalyst
- Don't anticipate breakout direction
- Scale out at targets
- Move stop to breakeven after first target
- Watch for Fed Chair announcement
Invalidation Levels
Bullish thesis invalidated if:
- Price closes below 96.218 (52-week low)
- Descending wedge breaks down
- Fed signals aggressive rate cuts
- Dovish Fed Chair confirmed
Bearish thesis invalidated if:
- Price closes above 99.25 (major resistance)
- Descending wedge breaks up with volume
- Fed signals no more rate cuts
- Risk-off surge boosts Dollar
Key Events to Watch
- FOMC Minutes - Tuesday, December 30
- Fed Chair Announcement - Early 2026
- Year-End Positioning - Through January 1
- BOJ Policy Signals - January 23 meeting
- ECB Policy - February 5 meeting
Conclusion
The US Dollar Index is at a critical inflection point, trading at 98.130 within a descending wedge pattern. The Dollar is on track for its worst year since 2017 with -9.58% YTD losses, but a potential bullish reversal pattern is forming.
The Numbers:
- Current Price: 98.130
- YTD Performance: -9.58%
- 1-Year Performance: -9.21%
- 52-Week High: 110.176
- 52-Week Low: 96.218
- Technical Rating: SELL
Key Levels:
- 99.25 - Major resistance
- 98.80 - Wedge resistance / breakout level
- 98.13 - Current price
- 97.85-98.00 - Support zone
- 97.25 - Major support
- 96.218 - 52-WEEK LOW
The Setup:
Descending wedge pattern with ascending channel forming at bottom. Fundamentals are bearish (Fed rate cuts, dovish Fed Chair concerns), but technicals suggest potential reversal. FOMC minutes Tuesday could be the catalyst.
Strategy:
- NEUTRAL stance - wait for confirmation
- Long above 98.80, target 99.25, 100.00
- Short below 97.25, target 96.50, 96.218
- FOMC minutes Tuesday = key catalyst
- Respect the pattern
The Dollar is at a crossroads. The descending wedge suggests potential bullish reversal, but fundamental headwinds remain strong. Wait for the breakout.

The Institutional Grade Trading Ecosystem, Built to win trades 📈
Get Access 👇
jackofalltrades.vip 🌐
t.me/jackofalltradesvip 🃏
Get Access 👇
jackofalltrades.vip 🌐
t.me/jackofalltradesvip 🃏
Declinazione di responsabilità
Le informazioni e le pubblicazioni non sono intese come, e non costituiscono, consulenza o raccomandazioni finanziarie, di investimento, di trading o di altro tipo fornite o approvate da TradingView. Per ulteriori informazioni, consultare i Termini di utilizzo.
The Institutional Grade Trading Ecosystem, Built to win trades 📈
Get Access 👇
jackofalltrades.vip 🌐
t.me/jackofalltradesvip 🃏
Get Access 👇
jackofalltrades.vip 🌐
t.me/jackofalltradesvip 🃏
Declinazione di responsabilità
Le informazioni e le pubblicazioni non sono intese come, e non costituiscono, consulenza o raccomandazioni finanziarie, di investimento, di trading o di altro tipo fornite o approvate da TradingView. Per ulteriori informazioni, consultare i Termini di utilizzo.