
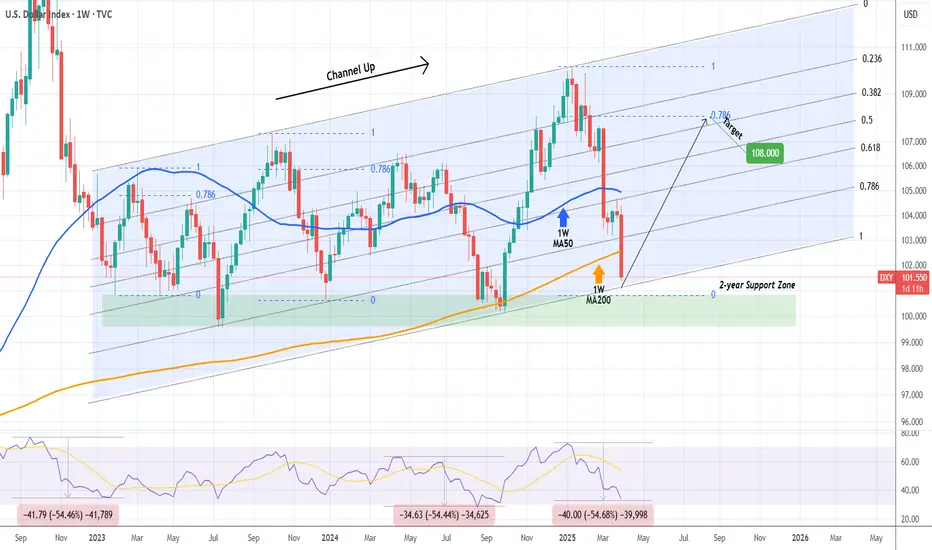
The U.S. Dollar index (DXY) broke today below its 1W MA200 (orange trend-line) for the first time in 6 months (since the week of September 30 2024). By doing so, it has almost hit the bottom (Higher Lows trend-line) of the long-term Channel Up.
The last contact with the 1W MA200 initiated a massive Bullish Leg two weeks after, so it would be an encouraging development if the candle holds here or better yet even close above the 1W MA200.
If it does, we expect a new strong Bullish Leg to start, targeting initially at least the 0.786 horizontal (blue) Fibonacci level at 108.000.
If not, the 2-year Support Zone is the last defense, with 99.600 as its lowest level (the July 10 2023 Low). Below that, a multi-year downtrend for DXY awaits.
Notice however, the incredible 1W RSI symmetry between selling sequences. Since January 2023, we've had two -54.50% declines. Right now, the current decline since January 2025 is exactly at -54.50%. If DXY rebounds here, it will confirm this amazing symmetry.
-------------------------------------------------------------------------------
** Please LIKE 👍, FOLLOW ✅, SHARE 🙌 and COMMENT ✍ if you enjoy this idea! Also share your ideas and charts in the comments section below! This is best way to keep it relevant, support us, keep the content here free and allow the idea to reach as many people as possible. **
-------------------------------------------------------------------------------
💸💸💸💸💸💸
👇 👇 👇 👇 👇 👇
The last contact with the 1W MA200 initiated a massive Bullish Leg two weeks after, so it would be an encouraging development if the candle holds here or better yet even close above the 1W MA200.
If it does, we expect a new strong Bullish Leg to start, targeting initially at least the 0.786 horizontal (blue) Fibonacci level at 108.000.
If not, the 2-year Support Zone is the last defense, with 99.600 as its lowest level (the July 10 2023 Low). Below that, a multi-year downtrend for DXY awaits.
Notice however, the incredible 1W RSI symmetry between selling sequences. Since January 2023, we've had two -54.50% declines. Right now, the current decline since January 2025 is exactly at -54.50%. If DXY rebounds here, it will confirm this amazing symmetry.
-------------------------------------------------------------------------------
** Please LIKE 👍, FOLLOW ✅, SHARE 🙌 and COMMENT ✍ if you enjoy this idea! Also share your ideas and charts in the comments section below! This is best way to keep it relevant, support us, keep the content here free and allow the idea to reach as many people as possible. **
-------------------------------------------------------------------------------
💸💸💸💸💸💸
👇 👇 👇 👇 👇 👇

I trade Crypto, Forex, Indices & Commodities on PrimeXBT — all from one account with TradingView charts 👉 tradingshot.short.gy/PrimeXBT
I also use TradeNation for fixed spreads & zero commission 👉 tradingshot.short.gy/Tradenation
I also use TradeNation for fixed spreads & zero commission 👉 tradingshot.short.gy/Tradenation
Declinazione di responsabilità
Le informazioni e le pubblicazioni non sono intese come, e non costituiscono, consulenza o raccomandazioni finanziarie, di investimento, di trading o di altro tipo fornite o approvate da TradingView. Per ulteriori informazioni, consultare i Termini di utilizzo.
I trade Crypto, Forex, Indices & Commodities on PrimeXBT — all from one account with TradingView charts 👉 tradingshot.short.gy/PrimeXBT
I also use TradeNation for fixed spreads & zero commission 👉 tradingshot.short.gy/Tradenation
I also use TradeNation for fixed spreads & zero commission 👉 tradingshot.short.gy/Tradenation
Declinazione di responsabilità
Le informazioni e le pubblicazioni non sono intese come, e non costituiscono, consulenza o raccomandazioni finanziarie, di investimento, di trading o di altro tipo fornite o approvate da TradingView. Per ulteriori informazioni, consultare i Termini di utilizzo.