
Good morning traders, today we bring you our analysis on the DXY index, along with an analysis of the potential behavior based on the short and long term zones.
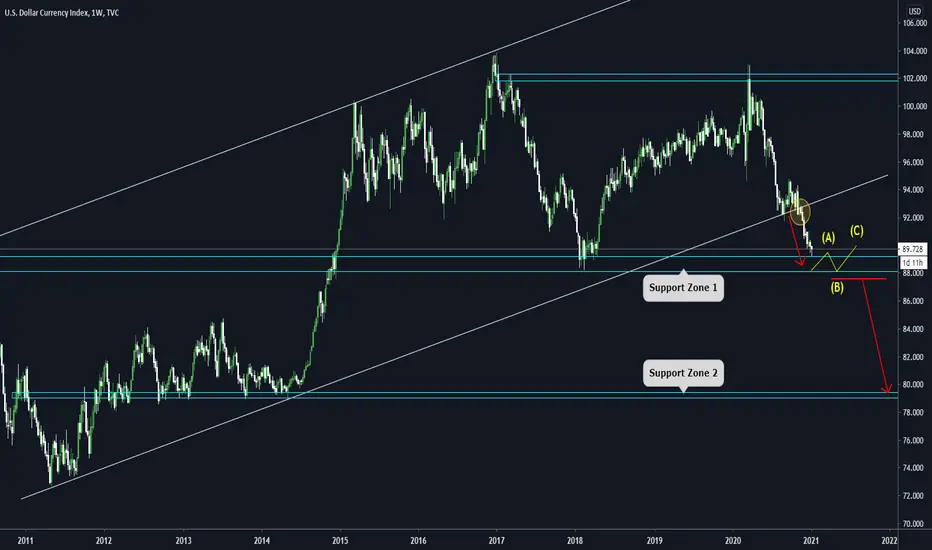
🔸For most of 2020, the price was in a downtrend after bouncing off the Resistance Zone.
🔸The movement was so strong that it managed to penetrate the Bullish Channel that had been active for almost 10 years to the downside.
🔸At this time, the price is approaching the Support Zone, where we will most likely see a reaction/consolidation for a few days/weeks.
🔸If the price does not make a strong reversal, we may see a breakout to the downside of this correction.
🔸In case this happens, the next support area is around $80, which would imply an interesting price drop.
🔸For most of 2020, the price was in a downtrend after bouncing off the Resistance Zone.
🔸The movement was so strong that it managed to penetrate the Bullish Channel that had been active for almost 10 years to the downside.
🔸At this time, the price is approaching the Support Zone, where we will most likely see a reaction/consolidation for a few days/weeks.
🔸If the price does not make a strong reversal, we may see a breakout to the downside of this correction.
🔸In case this happens, the next support area is around $80, which would imply an interesting price drop.

Declinazione di responsabilità
Le informazioni e le pubblicazioni non sono intese come, e non costituiscono, consulenza o raccomandazioni finanziarie, di investimento, di trading o di altro tipo fornite o approvate da TradingView. Per ulteriori informazioni, consultare i Termini di utilizzo.
Declinazione di responsabilità
Le informazioni e le pubblicazioni non sono intese come, e non costituiscono, consulenza o raccomandazioni finanziarie, di investimento, di trading o di altro tipo fornite o approvate da TradingView. Per ulteriori informazioni, consultare i Termini di utilizzo.