
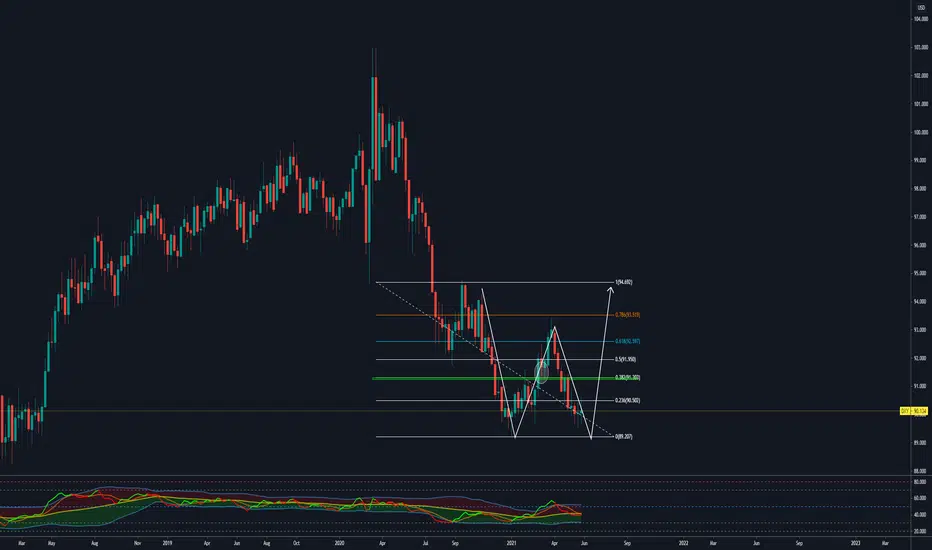
as I said on March 21 ... DXY is in a strong downward trend and if for 1 week it rejected 3 weeks in a row from the Fibonacci 0.5 area, I expect it to continue the descent to Fibonacci 382!
...exactly as I said in the last 3 months DXY rejected from the 786 Fibonacci level and went down thus closing the Fibonacci chart that I drew 3 months ago!
From this area, I expect DXY to reject and start rebuilding the W I've been talking about lately ....
THIS WEEK...as I was saying last week ... DXY has stopped falling and is starting to form support in this area and form W!
If the next weekly candle will still be green then I will look for BUY around 92,600 or even higher ...
NOTE: Please, give a LIKE if you find this idea useful!
GREAT ATTENTION:
*This information is not a Financial Advice.
...exactly as I said in the last 3 months DXY rejected from the 786 Fibonacci level and went down thus closing the Fibonacci chart that I drew 3 months ago!
From this area, I expect DXY to reject and start rebuilding the W I've been talking about lately ....
THIS WEEK...as I was saying last week ... DXY has stopped falling and is starting to form support in this area and form W!
If the next weekly candle will still be green then I will look for BUY around 92,600 or even higher ...
NOTE: Please, give a LIKE if you find this idea useful!
GREAT ATTENTION:
*This information is not a Financial Advice.

Declinazione di responsabilità
Le informazioni e le pubblicazioni non sono intese come, e non costituiscono, consulenza o raccomandazioni finanziarie, di investimento, di trading o di altro tipo fornite o approvate da TradingView. Per ulteriori informazioni, consultare i Termini di utilizzo.
Declinazione di responsabilità
Le informazioni e le pubblicazioni non sono intese come, e non costituiscono, consulenza o raccomandazioni finanziarie, di investimento, di trading o di altro tipo fornite o approvate da TradingView. Per ulteriori informazioni, consultare i Termini di utilizzo.