
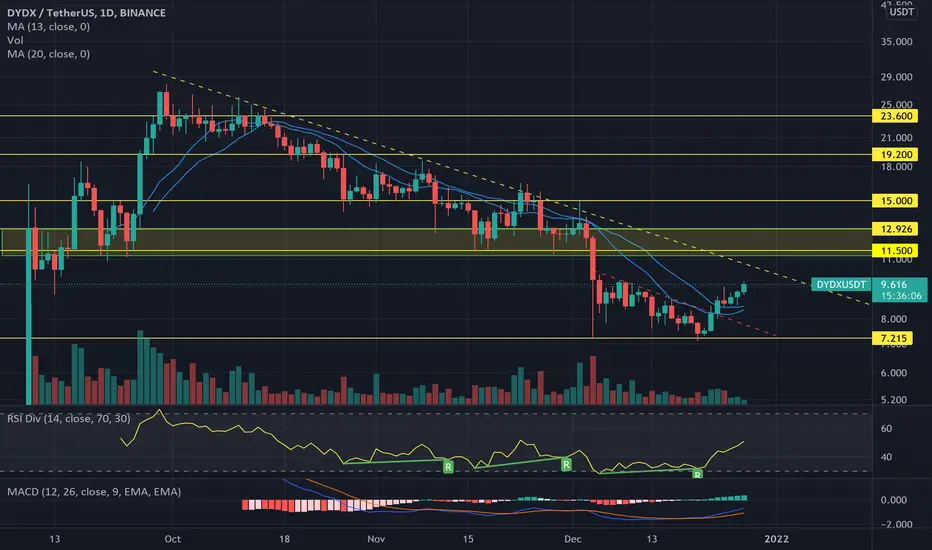
DYDX seems to bottom out. It closed bullish in weekly chart after 11 weeks. It closed bullish on daily chart as well and even made a break from the smaller falling wedge (red dotted line). The price is now trading above 13 and 20 MA and closing the gap to larger falling wedge – break above would trigger very bullish move (yellow dotted line). DYDX has lots of potential on the upside. My targets; TP1 $11.5, TP2 $15, TP3 19.2, TP4 $23.6; SL under 7.1 - small chance.

Declinazione di responsabilità
Le informazioni e le pubblicazioni non sono intese come, e non costituiscono, consulenza o raccomandazioni finanziarie, di investimento, di trading o di altro tipo fornite o approvate da TradingView. Per ulteriori informazioni, consultare i Termini di utilizzo.
Declinazione di responsabilità
Le informazioni e le pubblicazioni non sono intese come, e non costituiscono, consulenza o raccomandazioni finanziarie, di investimento, di trading o di altro tipo fornite o approvate da TradingView. Per ulteriori informazioni, consultare i Termini di utilizzo.