Long
EOS USDT BUY
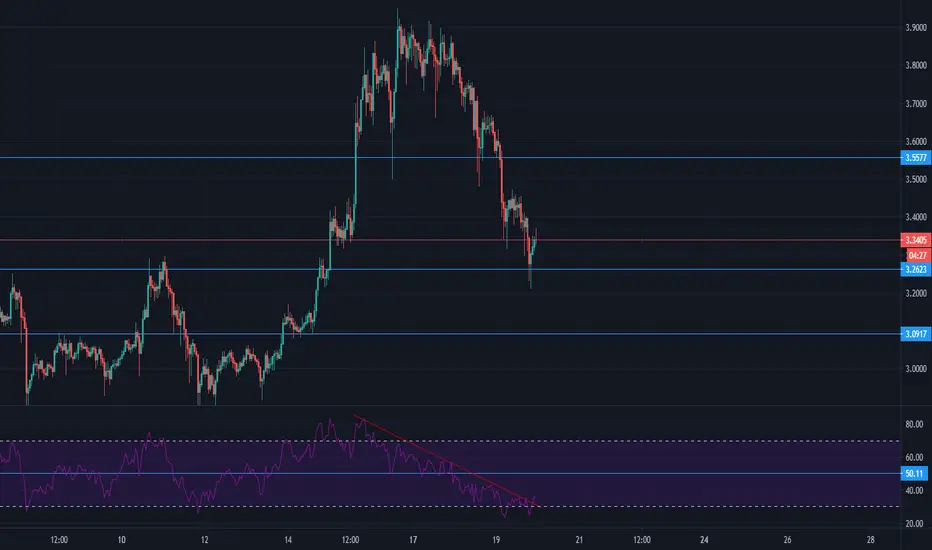
Horizontal line at 3.2623 is my area of value which is also acting as my SR line. Price was tested the support line and is now bullish. The red and green candle that tested my support line formed a morning star on the 30 Minutes time frame indicating that there will be a bullish movement. There were series of lower highs on my RSI (14) until the market was oversold (below 30 level). It has broken the resistance of the trend line drawn on the RSI and also broke pass the oversold level.
I choose to go long taking my profit at horizontal line 3.5577. If price comes back to hit horizontal line 3.1669, the trade will be invalid (Stop Loss).
I choose to go long taking my profit at horizontal line 3.5577. If price comes back to hit horizontal line 3.1669, the trade will be invalid (Stop Loss).

Declinazione di responsabilità
Le informazioni e le pubblicazioni non sono intese come, e non costituiscono, consulenza o raccomandazioni finanziarie, di investimento, di trading o di altro tipo fornite o approvate da TradingView. Per ulteriori informazioni, consultare i Termini di utilizzo.
Declinazione di responsabilità
Le informazioni e le pubblicazioni non sono intese come, e non costituiscono, consulenza o raccomandazioni finanziarie, di investimento, di trading o di altro tipo fornite o approvate da TradingView. Per ulteriori informazioni, consultare i Termini di utilizzo.