
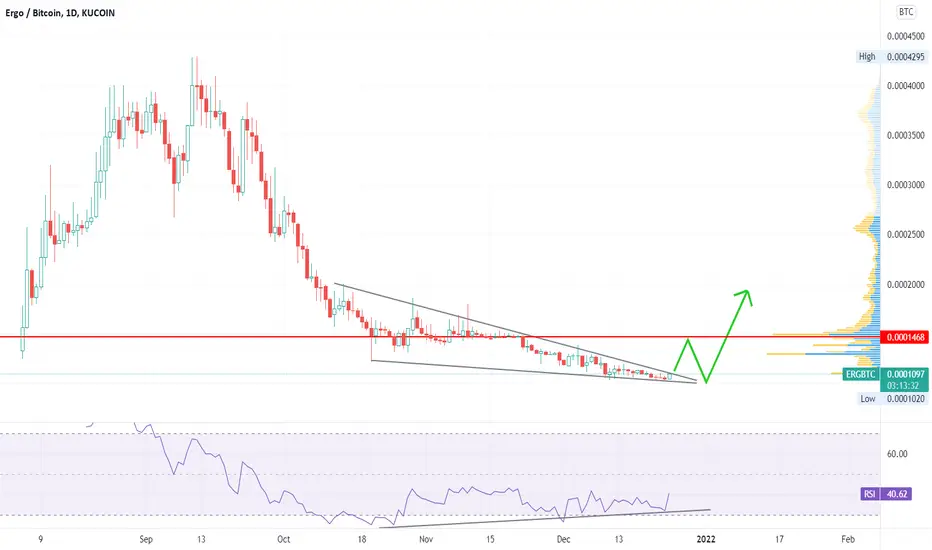
We see a falling wedge on the ERGBTC chart that has been running since 20 October. We see that RSI has been steadily increasing making an RSI divergence. Once price breaks above the falling wedge, this will be our confirmation for entry. I would set a tight stop loss at 1016 Sat and look for an early exit at the 1474 Sat support/resistance line, anticipating a retest of the top of the falling wedge.
Follow me for updates on this trade and others.
Follow me for updates on this trade and others.

Declinazione di responsabilità
Le informazioni e le pubblicazioni non sono intese come, e non costituiscono, consulenza o raccomandazioni finanziarie, di investimento, di trading o di altro tipo fornite o approvate da TradingView. Per ulteriori informazioni, consultare i Termini di utilizzo.
Declinazione di responsabilità
Le informazioni e le pubblicazioni non sono intese come, e non costituiscono, consulenza o raccomandazioni finanziarie, di investimento, di trading o di altro tipo fornite o approvate da TradingView. Per ulteriori informazioni, consultare i Termini di utilizzo.