
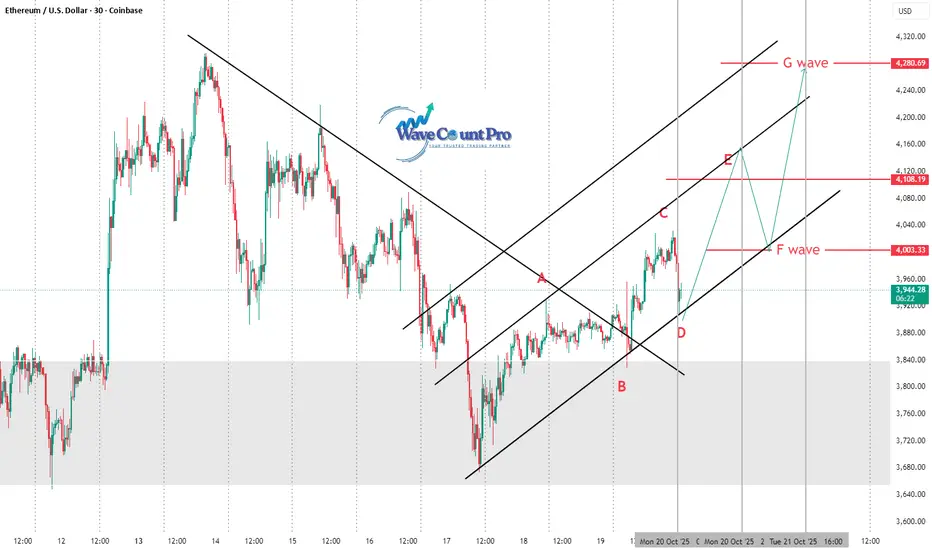
The chart displays Ethereum (ETH/USD) on a 30-minute timeframe, with a technical analysis predicting a potential upward movement using labeled wave structures (A to G). Here's a summary:
Key Elements:
Channel Analysis: Price is moving within an upward channel bounded by two black trendlines.
Breakout Zone: The previous downtrend (marked by a diagonal black resistance) was broken near point A, initiating a potential bullish reversal.
Wave Structure:
A → B → C → D: Price formed higher lows and higher highs within the channel.
Predicted Move: The chart projects a bullish continuation from point D to:
E (around $4,108)
A minor pullback to F ($4,003)
Then a final push to G (around $4,280)
Support & Resistance Levels:
Support Zones: Around $3,800 (highlighted grey box) and $4,003 (F wave).
Resistance Zones: $4,108 (E wave) and $4,280 (G wave).
Conclusion:
The chart suggests a bullish wave pattern is forming, with potential short-term pullbacks before pushing toward higher resistance levels. The trader anticipates ETH to follow a wave-like climb within the rising channel.
Key Elements:
Channel Analysis: Price is moving within an upward channel bounded by two black trendlines.
Breakout Zone: The previous downtrend (marked by a diagonal black resistance) was broken near point A, initiating a potential bullish reversal.
Wave Structure:
A → B → C → D: Price formed higher lows and higher highs within the channel.
Predicted Move: The chart projects a bullish continuation from point D to:
E (around $4,108)
A minor pullback to F ($4,003)
Then a final push to G (around $4,280)
Support & Resistance Levels:
Support Zones: Around $3,800 (highlighted grey box) and $4,003 (F wave).
Resistance Zones: $4,108 (E wave) and $4,280 (G wave).
Conclusion:
The chart suggests a bullish wave pattern is forming, with potential short-term pullbacks before pushing toward higher resistance levels. The trader anticipates ETH to follow a wave-like climb within the rising channel.
Trade chiuso: obiettivo raggiunto

Declinazione di responsabilità
Le informazioni e le pubblicazioni non sono intese come, e non costituiscono, consulenza o raccomandazioni finanziarie, di investimento, di trading o di altro tipo fornite o approvate da TradingView. Per ulteriori informazioni, consultare i Termini di utilizzo.
Declinazione di responsabilità
Le informazioni e le pubblicazioni non sono intese come, e non costituiscono, consulenza o raccomandazioni finanziarie, di investimento, di trading o di altro tipo fornite o approvate da TradingView. Per ulteriori informazioni, consultare i Termini di utilizzo.