
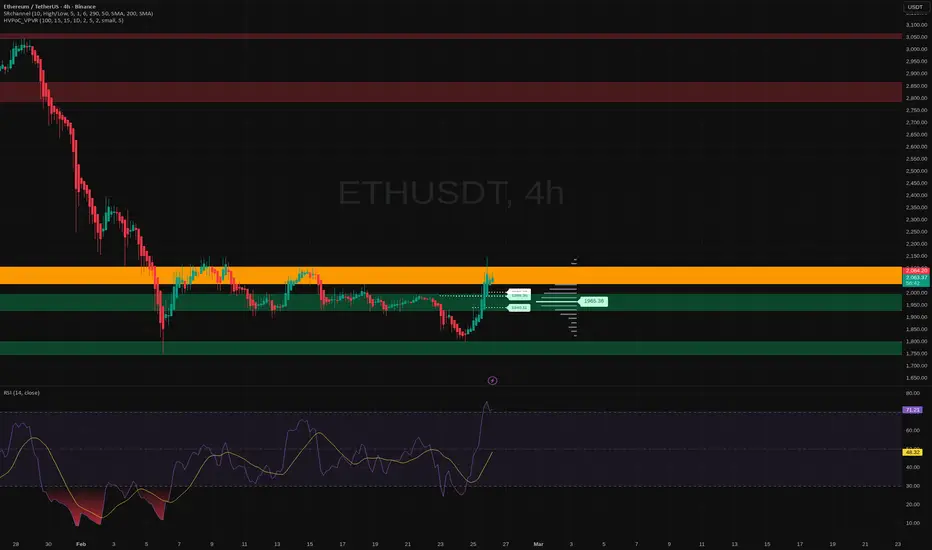
Let’s talk about trendlines on alts – the thing everyone draws, almost nobody respects, and the market loves to bully.
Alts are noisy. Wicks everywhere, liquidity thin, random 20% candles on a Tuesday night. If you draw trendlines on them the same way you do on BTC, you’ll constantly scream: “Fake breakout!” when in reality your line was trash.
Here’s how I treat trendlines on altcoins so they actually mean something.
1) Touches: 2 points start a line, 3 points make it real
I only take a trendline seriously after the third touch.
First 2 touches are just geometry. The 3rd is the market saying: “Yep, we see this too.”
On alts, I like:
- For support in an uptrend: at least 3 wick touches with bodies mostly above.
- For resistance in a downtrend: at least 3 touches with bodies mostly below.
One random wick hitting your line is not “respecting the trendline”, it’s just the market doing cardio.
2) Angle: if it’s too steep, it’s not a trend, it’s a chase
If your trendline looks almost vertical, you don’t have a trend – you have FOMO on a stick.
Rough logic I use:
- Slow, chill angle: often sustainable, good for swing trading.
- Medium angle: still fine, but I expect a sharper correction on break.
- Near vertical: I assume it breaks sooner rather than later and I don’t marry it.
On alts, I try to anchor trendlines from calm areas, not from the absolute bottom wick of some liquidation nuke. If the move started with a crazy V-shape candle, I usually ignore that wick and use the next swing low/high. Otherwise the line angle becomes insane and absolutely everything looks like a fake break.
3) Fake pokes: when price “breaks” but doesn’t really
Alts love fakeouts. You’ll see price pierce the trendline, everyone panics, then it closes right back above or below like nothing happened.
How I filter the noise:
- I trust candle closes, not just wicks
On higher timeframes (4H and up), if price wicks through the trendline but closes back inside, I often treat it as:
- A stop hunt
- A liquidity grab
- A “poke” to clean overleveraged positions
- Time spent outside the line
If price breaks the trendline but spends only one candle outside then instantly reclaims it on the next, that’s suspect. Real breaks usually:
- Hold outside the line
- Retest it from the other side
- Then continue
- Volume check
Clean break: often comes with strong volume and follow through.
Fake poke: sudden spike, no continuation, price drifts back into the old range.
4) Trendline “validity” checklist I quietly run in my head
- Is it drawn on a meaningful timeframe?
5 min trendlines on alts die faster than your patience. I prefer 1H, 4H, daily to define the main structure.
- Did I cherry pick points?
If I had to force the line so it fits my bias, it’s not a line, it’s fan fiction.
- Do other people likely see the same line?
The best trendlines are the obvious ones. If you need 10 zoom levels and a ruler to notice it, probably only you care.
Maybe I’m wrong, but most people don’t lose money because “trendlines don’t work” – they lose because they call every random diagonal on a 15 min alt chart a “trendline break”.
Last thing: a trendline is not a religion. It’s a guide. On alts, I use them as context:
- Confluence with support/resistance
- Confluence with a range high/low
- Confluence with volume zones
One trendline alone won’t make you rich. But a clean, respected line, with proper touches, sane angle, and awareness of fake pokes – that’s already a big step up from drawing diagonals just because the chart looks empty.
Alts are noisy. Wicks everywhere, liquidity thin, random 20% candles on a Tuesday night. If you draw trendlines on them the same way you do on BTC, you’ll constantly scream: “Fake breakout!” when in reality your line was trash.
Here’s how I treat trendlines on altcoins so they actually mean something.
1) Touches: 2 points start a line, 3 points make it real
I only take a trendline seriously after the third touch.
First 2 touches are just geometry. The 3rd is the market saying: “Yep, we see this too.”
On alts, I like:
- For support in an uptrend: at least 3 wick touches with bodies mostly above.
- For resistance in a downtrend: at least 3 touches with bodies mostly below.
One random wick hitting your line is not “respecting the trendline”, it’s just the market doing cardio.
2) Angle: if it’s too steep, it’s not a trend, it’s a chase
If your trendline looks almost vertical, you don’t have a trend – you have FOMO on a stick.
Rough logic I use:
- Slow, chill angle: often sustainable, good for swing trading.
- Medium angle: still fine, but I expect a sharper correction on break.
- Near vertical: I assume it breaks sooner rather than later and I don’t marry it.
On alts, I try to anchor trendlines from calm areas, not from the absolute bottom wick of some liquidation nuke. If the move started with a crazy V-shape candle, I usually ignore that wick and use the next swing low/high. Otherwise the line angle becomes insane and absolutely everything looks like a fake break.
3) Fake pokes: when price “breaks” but doesn’t really
Alts love fakeouts. You’ll see price pierce the trendline, everyone panics, then it closes right back above or below like nothing happened.
How I filter the noise:
- I trust candle closes, not just wicks
On higher timeframes (4H and up), if price wicks through the trendline but closes back inside, I often treat it as:
- A stop hunt
- A liquidity grab
- A “poke” to clean overleveraged positions
- Time spent outside the line
If price breaks the trendline but spends only one candle outside then instantly reclaims it on the next, that’s suspect. Real breaks usually:
- Hold outside the line
- Retest it from the other side
- Then continue
- Volume check
Clean break: often comes with strong volume and follow through.
Fake poke: sudden spike, no continuation, price drifts back into the old range.
4) Trendline “validity” checklist I quietly run in my head
- Is it drawn on a meaningful timeframe?
5 min trendlines on alts die faster than your patience. I prefer 1H, 4H, daily to define the main structure.
- Did I cherry pick points?
If I had to force the line so it fits my bias, it’s not a line, it’s fan fiction.
- Do other people likely see the same line?
The best trendlines are the obvious ones. If you need 10 zoom levels and a ruler to notice it, probably only you care.
Maybe I’m wrong, but most people don’t lose money because “trendlines don’t work” – they lose because they call every random diagonal on a 15 min alt chart a “trendline break”.
Last thing: a trendline is not a religion. It’s a guide. On alts, I use them as context:
- Confluence with support/resistance
- Confluence with a range high/low
- Confluence with volume zones
One trendline alone won’t make you rich. But a clean, respected line, with proper touches, sane angle, and awareness of fake pokes – that’s already a big step up from drawing diagonals just because the chart looks empty.

SIGNAL INDICATOR
NO REDESIGNING
✅Buy&Sell according to 7 strategies
✅Technical analysis according to 30+ parameters
✅WinRate of signals up to 75%
✅RR 1k3, no deep drawdowns!
Free test drive using my link:
👉t.me/Multiindicator_bot
NO REDESIGNING
✅Buy&Sell according to 7 strategies
✅Technical analysis according to 30+ parameters
✅WinRate of signals up to 75%
✅RR 1k3, no deep drawdowns!
Free test drive using my link:
👉t.me/Multiindicator_bot
Pubblicazioni correlate
Declinazione di responsabilità
Le informazioni e le pubblicazioni non sono intese come, e non costituiscono, consulenza o raccomandazioni finanziarie, di investimento, di trading o di altro tipo fornite o approvate da TradingView. Per ulteriori informazioni, consultare i Termini di utilizzo.
SIGNAL INDICATOR
NO REDESIGNING
✅Buy&Sell according to 7 strategies
✅Technical analysis according to 30+ parameters
✅WinRate of signals up to 75%
✅RR 1k3, no deep drawdowns!
Free test drive using my link:
👉t.me/Multiindicator_bot
NO REDESIGNING
✅Buy&Sell according to 7 strategies
✅Technical analysis according to 30+ parameters
✅WinRate of signals up to 75%
✅RR 1k3, no deep drawdowns!
Free test drive using my link:
👉t.me/Multiindicator_bot
Pubblicazioni correlate
Declinazione di responsabilità
Le informazioni e le pubblicazioni non sono intese come, e non costituiscono, consulenza o raccomandazioni finanziarie, di investimento, di trading o di altro tipo fornite o approvate da TradingView. Per ulteriori informazioni, consultare i Termini di utilizzo.