
📉 Technical Analysis: Ethereum (ETH/USDT)
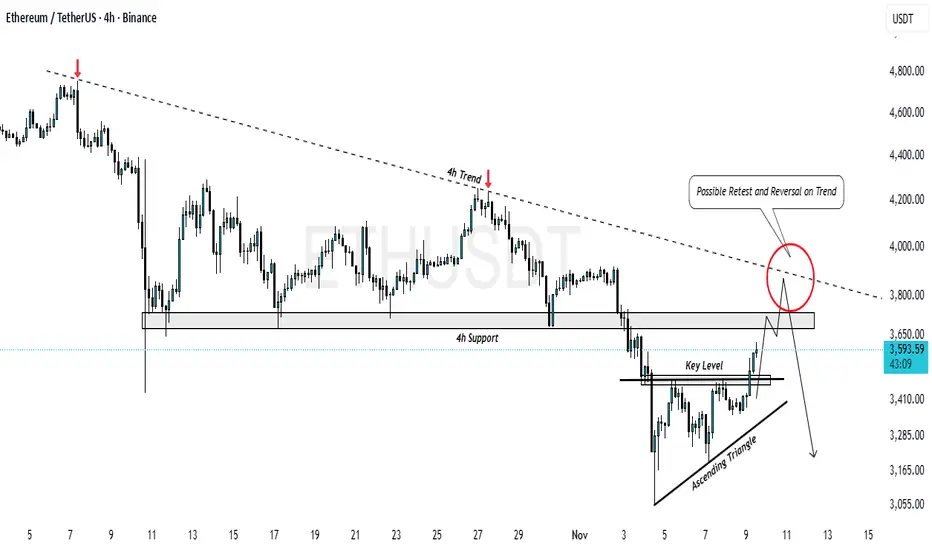
The price action is currently showing a downtrend following a significant drop from the highs around $4,800. A major 4-hour Support zone, previously established around $3,700 to $3,800, was decisively broken to the downside in early November. This support now acts as strong resistance.
Following the breakdown, the price has entered a consolidation phase, forming an Ascending Triangle pattern between approximately $3,200 and $3,500. This is typically a continuation pattern in the direction of the preceding trend (which was down), but a breakout above the flat resistance can signal a reversal.
The chart shows that the price has recently broken above a Key Level that represented the flat top of the Ascending Triangle and the immediate overhead resistance. The current price is around $3,589.94.
🧭 Projection
The breakout from the Ascending Triangle and the Key Level suggests bullish momentum in the short term, aiming for the next significant resistance.
The most critical resistance zone is the area of the previous 4-hour Support, now a Resistance Zone (marked on the chart between roughly $3,700 and $3,800). This resistance is strengthened by the convergence of the 4-hour Trendline (a major downtrend line) in the same general area.
Short-Term Bullish Scenario (Projected Move)
The price is projected to continue its climb toward the $3,700 - $3,800 Resistance Zone.
The area where the 4-hour Trendline and the old 4-hour Support/New Resistance meet is identified as the prime target for a Possible Retest and Reversal on Trend.
A strong rejection at this confluence of resistances would confirm the continuation of the overall downtrend, pushing the price lower, potentially back toward the lows around $3,200.
Long-Term Reversal Scenario
For a significant bullish reversal to be confirmed, the price would need a decisive, high-volume break and close above both the $3,800 Resistance Zone and the 4-hour Trendline. This would invalidate the major downtrend and open the path for a move back toward the $4,200 - $4,400 area.
However, the chart's current setup favors the retest and continuation of the bearish trend unless this major resistance is overcome.
In summary, the immediate move is projected to be up to the $3,700 - $3,800 zone, where the market will face a major test that will determine the mid-term direction.
The price action is currently showing a downtrend following a significant drop from the highs around $4,800. A major 4-hour Support zone, previously established around $3,700 to $3,800, was decisively broken to the downside in early November. This support now acts as strong resistance.
Following the breakdown, the price has entered a consolidation phase, forming an Ascending Triangle pattern between approximately $3,200 and $3,500. This is typically a continuation pattern in the direction of the preceding trend (which was down), but a breakout above the flat resistance can signal a reversal.
The chart shows that the price has recently broken above a Key Level that represented the flat top of the Ascending Triangle and the immediate overhead resistance. The current price is around $3,589.94.
🧭 Projection
The breakout from the Ascending Triangle and the Key Level suggests bullish momentum in the short term, aiming for the next significant resistance.
The most critical resistance zone is the area of the previous 4-hour Support, now a Resistance Zone (marked on the chart between roughly $3,700 and $3,800). This resistance is strengthened by the convergence of the 4-hour Trendline (a major downtrend line) in the same general area.
Short-Term Bullish Scenario (Projected Move)
The price is projected to continue its climb toward the $3,700 - $3,800 Resistance Zone.
The area where the 4-hour Trendline and the old 4-hour Support/New Resistance meet is identified as the prime target for a Possible Retest and Reversal on Trend.
A strong rejection at this confluence of resistances would confirm the continuation of the overall downtrend, pushing the price lower, potentially back toward the lows around $3,200.
Long-Term Reversal Scenario
For a significant bullish reversal to be confirmed, the price would need a decisive, high-volume break and close above both the $3,800 Resistance Zone and the 4-hour Trendline. This would invalidate the major downtrend and open the path for a move back toward the $4,200 - $4,400 area.
However, the chart's current setup favors the retest and continuation of the bearish trend unless this major resistance is overcome.
In summary, the immediate move is projected to be up to the $3,700 - $3,800 zone, where the market will face a major test that will determine the mid-term direction.
Trade chiuso: obiettivo raggiunto
Target Achieved
Pubblicazioni correlate
Declinazione di responsabilità
Le informazioni e le pubblicazioni non sono intese come, e non costituiscono, consulenza o raccomandazioni finanziarie, di investimento, di trading o di altro tipo fornite o approvate da TradingView. Per ulteriori informazioni, consultare i Termini di utilizzo.
Pubblicazioni correlate
Declinazione di responsabilità
Le informazioni e le pubblicazioni non sono intese come, e non costituiscono, consulenza o raccomandazioni finanziarie, di investimento, di trading o di altro tipo fornite o approvate da TradingView. Per ulteriori informazioni, consultare i Termini di utilizzo.