
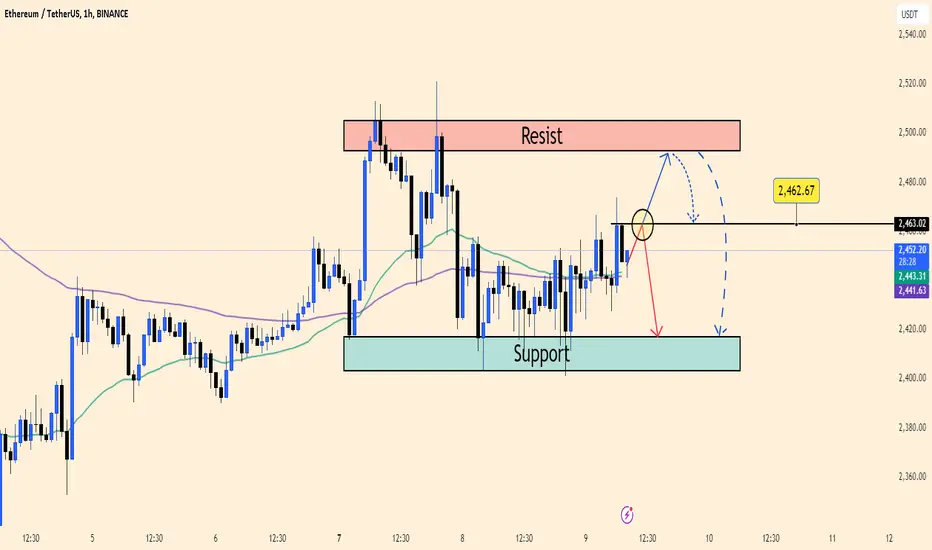
The ETH/USDT chart suggests a possible bearish move:
Resistance: Around $2,462, price may test this level but face rejection.
Support: The support zone is at $2,420, where the price could potentially fall.
Trading Plan: Short near $2,462 if rejection occurs, targeting the $2,420 support. Place a stop loss above $2,500 for safety.
This is a straightforward approach based on current chart patterns and key levels.
Resistance: Around $2,462, price may test this level but face rejection.
Support: The support zone is at $2,420, where the price could potentially fall.
Trading Plan: Short near $2,462 if rejection occurs, targeting the $2,420 support. Place a stop loss above $2,500 for safety.
This is a straightforward approach based on current chart patterns and key levels.
Trade chiuso: obiettivo raggiunto
nice 
Pubblicazioni correlate
Declinazione di responsabilità
Le informazioni e le pubblicazioni non sono intese come, e non costituiscono, consulenza o raccomandazioni finanziarie, di investimento, di trading o di altro tipo fornite o approvate da TradingView. Per ulteriori informazioni, consultare i Termini di utilizzo.
Pubblicazioni correlate
Declinazione di responsabilità
Le informazioni e le pubblicazioni non sono intese come, e non costituiscono, consulenza o raccomandazioni finanziarie, di investimento, di trading o di altro tipo fornite o approvate da TradingView. Per ulteriori informazioni, consultare i Termini di utilizzo.