
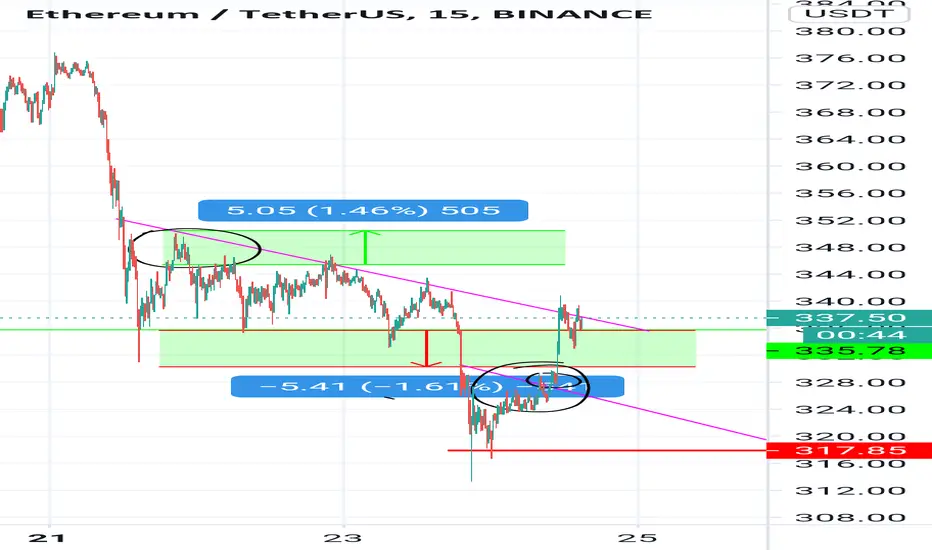
In the graph I have rounded two points..the curves look similar but difference between two moves are..the above curve retested the resistance level..but it took downward path..
The below curve why it exploded up? The reason is after retest near the resistance it consolidated near the resistance that's a indicator of a bullish move..the inner circle below circled one is the consolidated area
The below curve why it exploded up? The reason is after retest near the resistance it consolidated near the resistance that's a indicator of a bullish move..the inner circle below circled one is the consolidated area
Trade chiuso: obiettivo raggiunto
If u guys watch the move in 5m time frame it would be a better clarity
Declinazione di responsabilità
Le informazioni e le pubblicazioni non sono intese come, e non costituiscono, consulenza o raccomandazioni finanziarie, di investimento, di trading o di altro tipo fornite o approvate da TradingView. Per ulteriori informazioni, consultare i Termini di utilizzo.
Declinazione di responsabilità
Le informazioni e le pubblicazioni non sono intese come, e non costituiscono, consulenza o raccomandazioni finanziarie, di investimento, di trading o di altro tipo fornite o approvate da TradingView. Per ulteriori informazioni, consultare i Termini di utilizzo.