
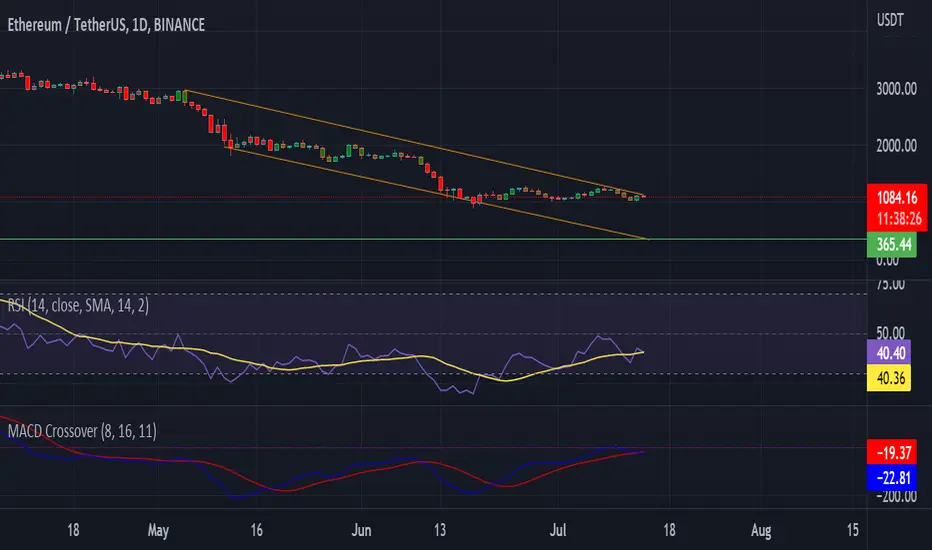
The Ethereum/ TetherUS graph displays trend lines that present a bareish sentiment. These trend lines are based on Ethereum’s/ TetherUS swing low/ high price since 05/05/22. Based on current price action, Ethereum’s value of $1080 is in line with the trend line’s resistance, supporting a bearish correction. Ethereum is technically oversold based on its 40- RSI. Not only this, divergence between signal and MACD lines appear to be tightening, suggesting a likely cross over of the MACD line. For this reason, it is reasonable to assume a correction towards the support and away from its resistance. Therefore, the buyer taking a short position should buy close to the resistance at $1080 and sell at its support at $365.

💥 Free signals and ideas ➡ t.me/vfinvestment
Pubblicazioni correlate
Declinazione di responsabilità
Le informazioni e le pubblicazioni non sono intese come, e non costituiscono, consulenza o raccomandazioni finanziarie, di investimento, di trading o di altro tipo fornite o approvate da TradingView. Per ulteriori informazioni, consultare i Termini di utilizzo.
💥 Free signals and ideas ➡ t.me/vfinvestment
Pubblicazioni correlate
Declinazione di responsabilità
Le informazioni e le pubblicazioni non sono intese come, e non costituiscono, consulenza o raccomandazioni finanziarie, di investimento, di trading o di altro tipo fornite o approvate da TradingView. Per ulteriori informazioni, consultare i Termini di utilizzo.