

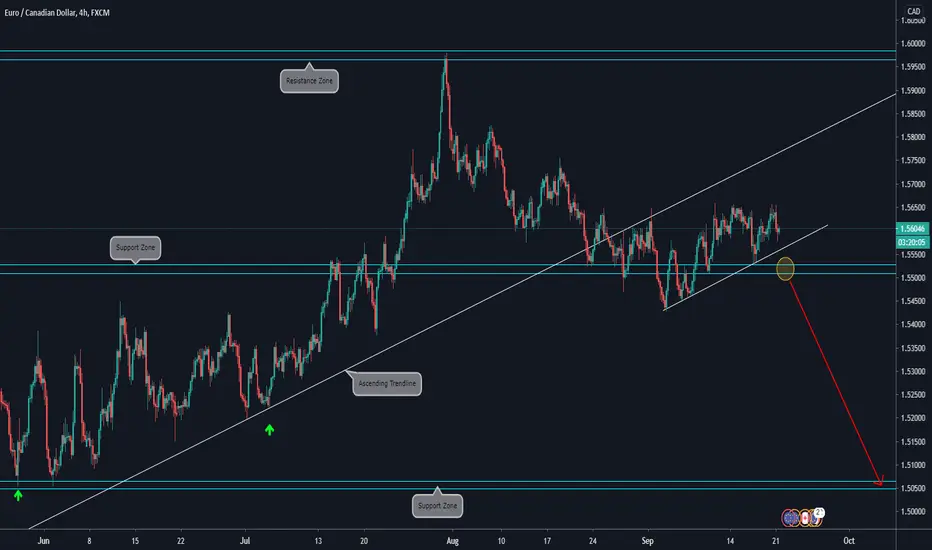
🔸4H CHART EXPLANATION:
.
.
🔸Price broke the Ascending Trendline.
.
🔸As we can observe, it has been choppy for the last weeks consolidating on a corrective structure.
.
🔸We are waiting for a breakout to the downside, and also we need a break of the Support Zone. The potential target is the next Support at 1.50500.
.
🔸 Will look for a lower timeframe bearish setup once the direction is clear.
🔸DAILY CHART ANALYSIS:

.
.
🔸Price broke the Ascending Trendline.
.
🔸As we can observe, it has been choppy for the last weeks consolidating on a corrective structure.
.
🔸We are waiting for a breakout to the downside, and also we need a break of the Support Zone. The potential target is the next Support at 1.50500.
.
🔸 Will look for a lower timeframe bearish setup once the direction is clear.
🔸DAILY CHART ANALYSIS:

Pubblicazioni correlate
Declinazione di responsabilità
Le informazioni e le pubblicazioni non sono intese come, e non costituiscono, consulenza o raccomandazioni finanziarie, di investimento, di trading o di altro tipo fornite o approvate da TradingView. Per ulteriori informazioni, consultare i Termini di utilizzo.
Pubblicazioni correlate
Declinazione di responsabilità
Le informazioni e le pubblicazioni non sono intese come, e non costituiscono, consulenza o raccomandazioni finanziarie, di investimento, di trading o di altro tipo fornite o approvate da TradingView. Per ulteriori informazioni, consultare i Termini di utilizzo.