

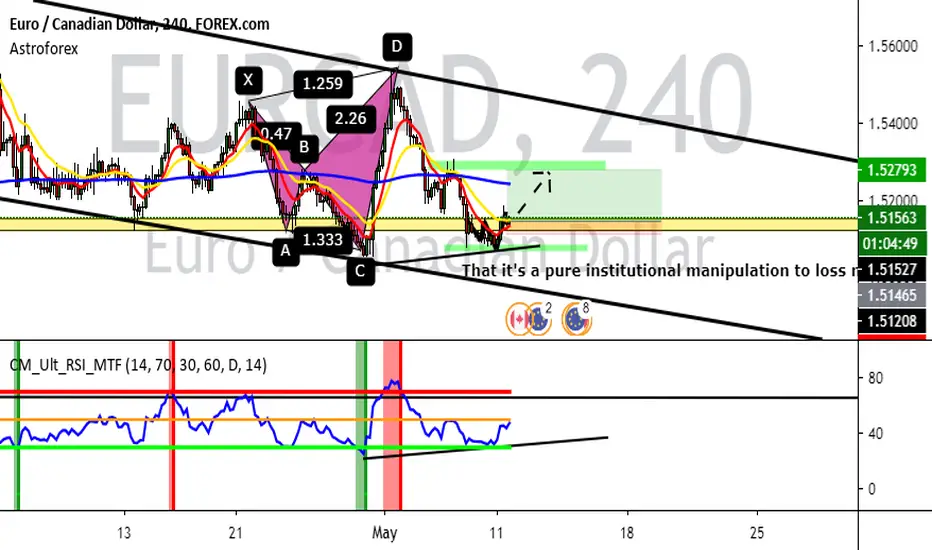
Hello, in H4 timeframe, I'm looking a bullish divergence what I find up in this interesting opportunity chart to entry in a long position. So, the reason that I make this technical analysis that I see a proyection a bullish for this par, on some moment EUR/CAD was represent a manipulation zone in H4 or H1 that we can see much better.
I want to show you why EUR/CAD is bullish and why this daily support zone can't broke down. If you see this screenshoot below in this description, there are a strong suppport in this par that never was broke, and any case was a fake break out. And also, and a strond support daily in yellow zone that I see.


In this screenshoot, in this par EURO/Canadian Dollar we are in the bubble that we are in the supply and the RSI it's say that we could see a possible correction in this par to enter in a bearish trend. What do you think about it?
But rememeber this par is come from a bearish and a big channel bearish!!! So, the structure original if you see in weekly or montly is supply. So, this is my technial analysis and my idea so what do the price do
I want to show you why EUR/CAD is bullish and why this daily support zone can't broke down. If you see this screenshoot below in this description, there are a strong suppport in this par that never was broke, and any case was a fake break out. And also, and a strond support daily in yellow zone that I see.
In this screenshoot, in this par EURO/Canadian Dollar we are in the bubble that we are in the supply and the RSI it's say that we could see a possible correction in this par to enter in a bearish trend. What do you think about it?
But rememeber this par is come from a bearish and a big channel bearish!!! So, the structure original if you see in weekly or montly is supply. So, this is my technial analysis and my idea so what do the price do

Declinazione di responsabilità
Le informazioni e le pubblicazioni non sono intese come, e non costituiscono, consulenza o raccomandazioni finanziarie, di investimento, di trading o di altro tipo fornite o approvate da TradingView. Per ulteriori informazioni, consultare i Termini di utilizzo.
Declinazione di responsabilità
Le informazioni e le pubblicazioni non sono intese come, e non costituiscono, consulenza o raccomandazioni finanziarie, di investimento, di trading o di altro tipo fornite o approvate da TradingView. Per ulteriori informazioni, consultare i Termini di utilizzo.