

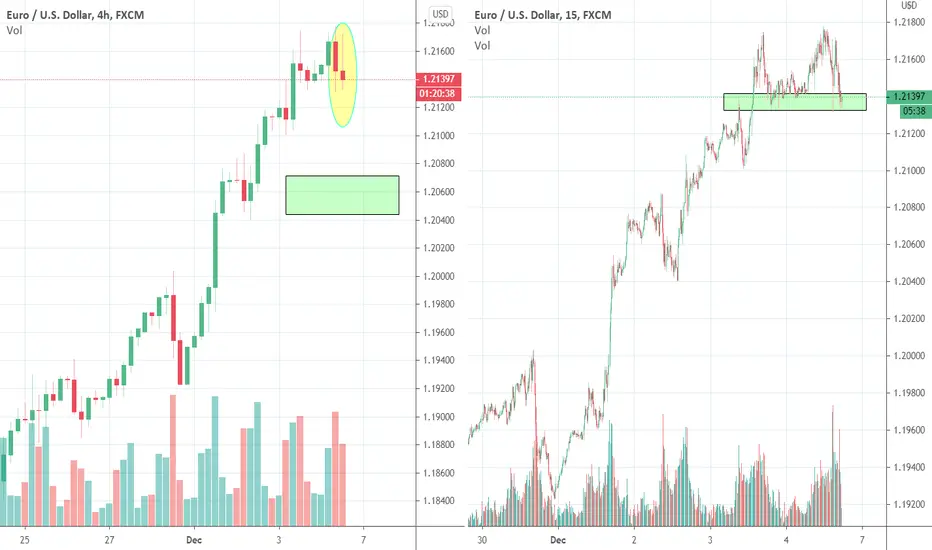
Current 4H candle might become a small sell signal (at first). Think if the current 4H candle closes below 1.213, we should see a bit more downwards pressure. Past day i had in mind, that if it doesn't break 1.22ish, there is a still a chance that the breakout of past weeks might get stopped and see some zig zagging coming weeks or more.
So needs a close below that green zone. Also when looking at the DXY chart, looks like a possible low being set (similar picture but upside down).
Think a first target then would be around 1.2050ish. As long as 1.19ish holds, the trend is up. If it breaks, we could see a period of zig zagging between 1.15/1.22
Previous analysis:
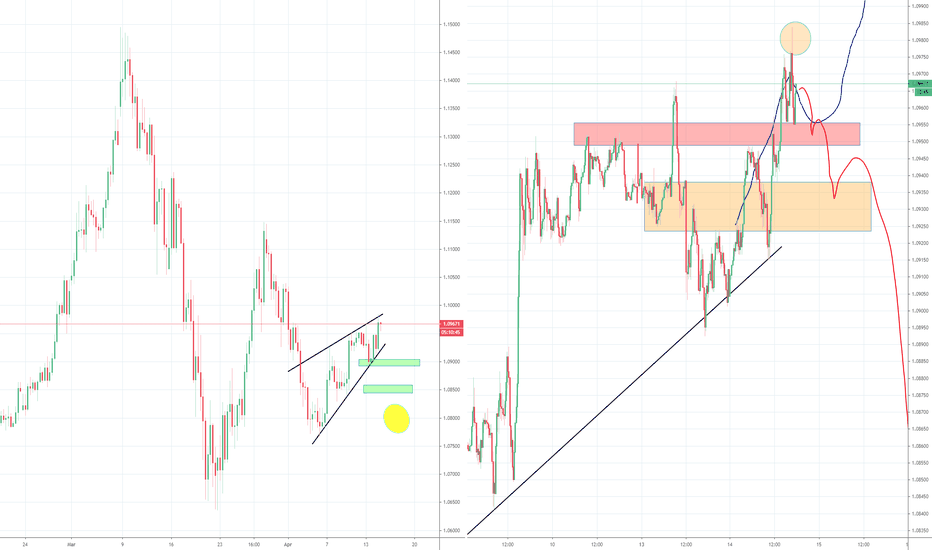
So needs a close below that green zone. Also when looking at the DXY chart, looks like a possible low being set (similar picture but upside down).
Think a first target then would be around 1.2050ish. As long as 1.19ish holds, the trend is up. If it breaks, we could see a period of zig zagging between 1.15/1.22
Previous analysis:
Nota
New/update analysis EURUSD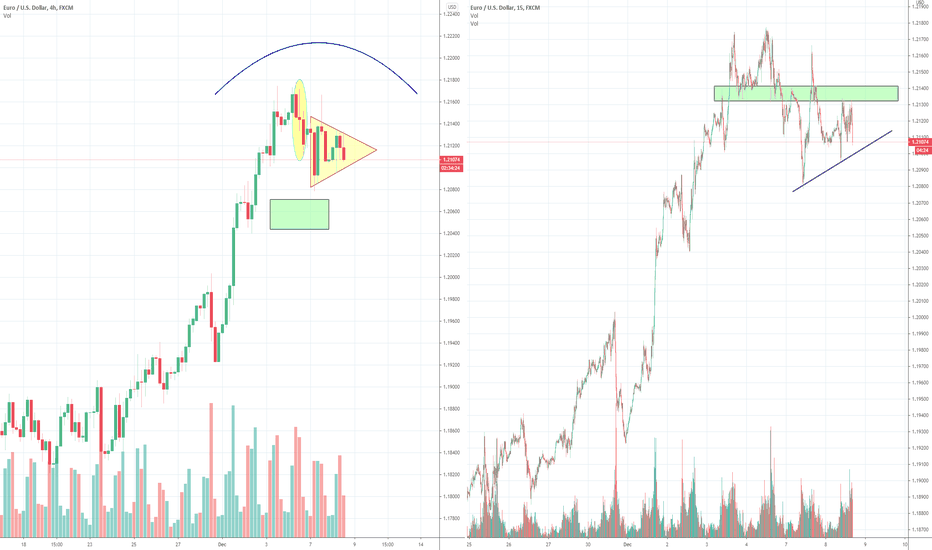

Declinazione di responsabilità
Le informazioni e le pubblicazioni non sono intese come, e non costituiscono, consulenza o raccomandazioni finanziarie, di investimento, di trading o di altro tipo fornite o approvate da TradingView. Per ulteriori informazioni, consultare i Termini di utilizzo.
Declinazione di responsabilità
Le informazioni e le pubblicazioni non sono intese come, e non costituiscono, consulenza o raccomandazioni finanziarie, di investimento, di trading o di altro tipo fornite o approvate da TradingView. Per ulteriori informazioni, consultare i Termini di utilizzo.