
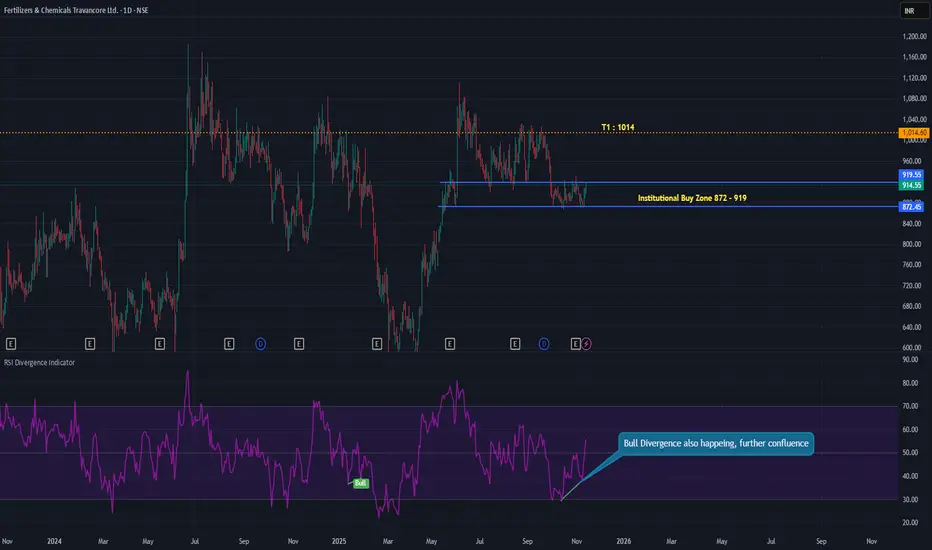
Stock Price is well inside Accumulation Zone and also RSI Divergence can be seen on the daily time frame, Stock has very good fundamentals, Price may reverse from here to hit the Targets as shown in the diagram.
Fundamentals Snap Shot :-
Short Overall View on These Metrics
Sales / Revenue growth:
Long-term revenues have grown strongly from ~₹2,000 cr to a 6,000+ cr peak,
But last two years show clear decline, and 3-year sales CAGR is now negative.
OPM %:
Peaked around 13–17% (FY20–22); now down to 2–4%.
Indicates margin pressure (costs, pricing, or mix issues).
EPS:
Boosted historically by large “Other Income”;
Recent EPS is weak and volatile, far below earlier peaks.
Cash reserves:
Big positive: cash & bank balances of nearly ₹2,800 cr, growing every year;
With borrowings ~₹1,800 cr, FACT now appears net-cash positive.
Fundamentals Snap Shot :-
Short Overall View on These Metrics
Sales / Revenue growth:
Long-term revenues have grown strongly from ~₹2,000 cr to a 6,000+ cr peak,
But last two years show clear decline, and 3-year sales CAGR is now negative.
OPM %:
Peaked around 13–17% (FY20–22); now down to 2–4%.
Indicates margin pressure (costs, pricing, or mix issues).
EPS:
Boosted historically by large “Other Income”;
Recent EPS is weak and volatile, far below earlier peaks.
Cash reserves:
Big positive: cash & bank balances of nearly ₹2,800 cr, growing every year;
With borrowings ~₹1,800 cr, FACT now appears net-cash positive.

Declinazione di responsabilità
Le informazioni e le pubblicazioni non sono intese come, e non costituiscono, consulenza o raccomandazioni finanziarie, di investimento, di trading o di altro tipo fornite o approvate da TradingView. Per ulteriori informazioni, consultare i Termini di utilizzo.
Declinazione di responsabilità
Le informazioni e le pubblicazioni non sono intese come, e non costituiscono, consulenza o raccomandazioni finanziarie, di investimento, di trading o di altro tipo fornite o approvate da TradingView. Per ulteriori informazioni, consultare i Termini di utilizzo.