
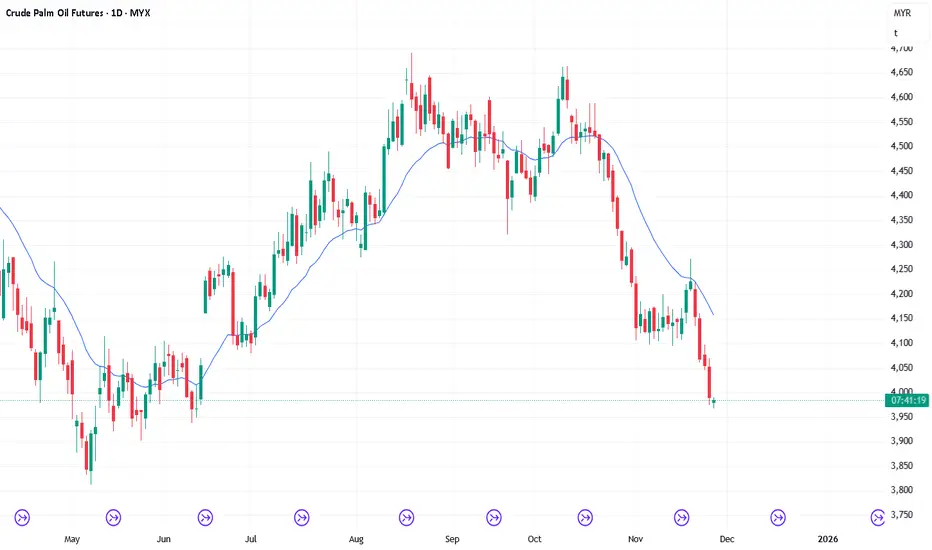
- Tuesday’s candlestick (Nov 25) was another follow-through small bear bar closing near its low with a small tail below.
- In our previous report, we stated that traders would watch to see if the bears could create more follow-through selling and extend the second leg sideways to down, or if the market would stall around the 4000 area and form candlesticks with long tails below in the days ahead, which could indicate some profit-taking activity.
- The market traded lower to reach the measured move target of 4000-3950.
- The bulls hope the current decline will form a major higher low.
- They hope the recent tight trading range will be the final flag of the move and want the market to reverse back into the tight trading range.
- At the least, they hope for a small pullback to the 20-day EMA.
- They must produce strong consecutive bull bars to show they are clearly in control. They haven't been able to do so.
- The bears’ measured-move target, based on the height of the prior trading range, projects toward the 4000–3950 area. They have achieved this.
- The next target for the bears is the May low, around the 3800-50 area.
- The selloff formed a tight bear channel, indicating strong bearish sentiment and persistent selling pressure.
- If there is a small pullback, odds slightly favor at least a small sideways to down leg to retest the current leg low (now Nov 25).
- They need to continue creating follow-through selling to reach the measured move targets.
- Fundamentals
- • Production: SPPOMA increased by about 10% in the first 20 days.
- • Refineries: Buying interest slightly lukewarm. Some refineries are reporting high stock. Not paying premiums vs spot futures.
- • Exports: ITS said exports are down 18.48% in the first 25 days.
- Overall, the market sold off in a tight bear channel, indicating strong selling momentum.
- The market remains Always-In-Short.
- Today (Wednesday, Nov. 26), traders will watch to see if the bears can create more follow-through selling and extend the second leg sideways to down.
- Or will the market stall around the 4000 area and form candlesticks with long tails below in the days ahead, which can indicate some profit-taking activity?
Andrew

Pubblicazioni correlate
Declinazione di responsabilità
Le informazioni e le pubblicazioni non sono intese come, e non costituiscono, consulenza o raccomandazioni finanziarie, di investimento, di trading o di altro tipo fornite o approvate da TradingView. Per ulteriori informazioni, consultare i Termini di utilizzo.
Pubblicazioni correlate
Declinazione di responsabilità
Le informazioni e le pubblicazioni non sono intese come, e non costituiscono, consulenza o raccomandazioni finanziarie, di investimento, di trading o di altro tipo fornite o approvate da TradingView. Per ulteriori informazioni, consultare i Termini di utilizzo.