
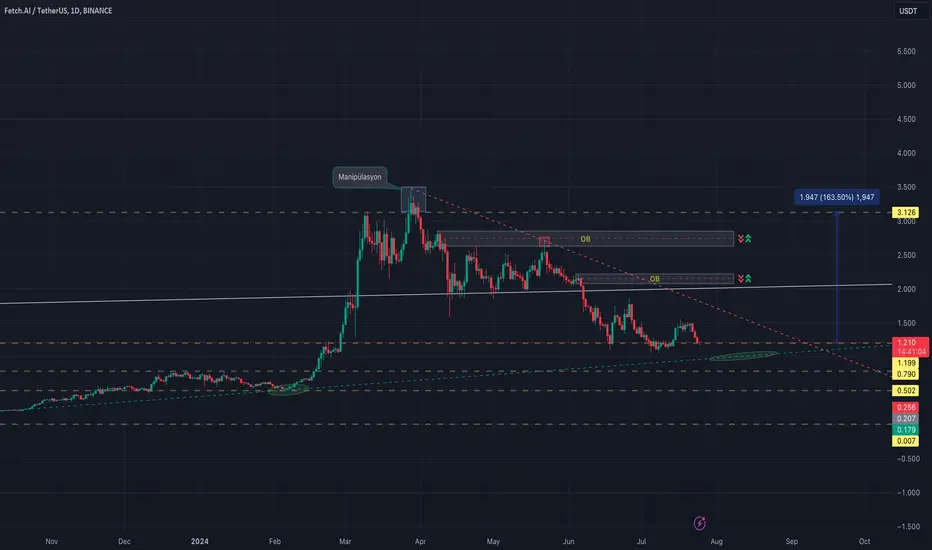
 FET 1D chart;
The $1,199 level is a strong resistance and it seems to be using it as a balance level.
If there is another possible pullback, it may hit the lower trend line.
It is moving towards a narrowing between the trends and it would not be a surprise if it makes an upward move after the squeeze.
We can consider OB levels as possible resistance zones. Therefore, it may make retracements from here.

For more you can follow me on X. @UgurTash
Declinazione di responsabilità
Le informazioni e le pubblicazioni non sono intese come, e non costituiscono, consulenza o raccomandazioni finanziarie, di investimento, di trading o di altro tipo fornite o approvate da TradingView. Per ulteriori informazioni, consultare i Termini di utilizzo.
For more you can follow me on X. @UgurTash
Declinazione di responsabilità
Le informazioni e le pubblicazioni non sono intese come, e non costituiscono, consulenza o raccomandazioni finanziarie, di investimento, di trading o di altro tipo fornite o approvate da TradingView. Per ulteriori informazioni, consultare i Termini di utilizzo.