☀️ ☀️ ☀️
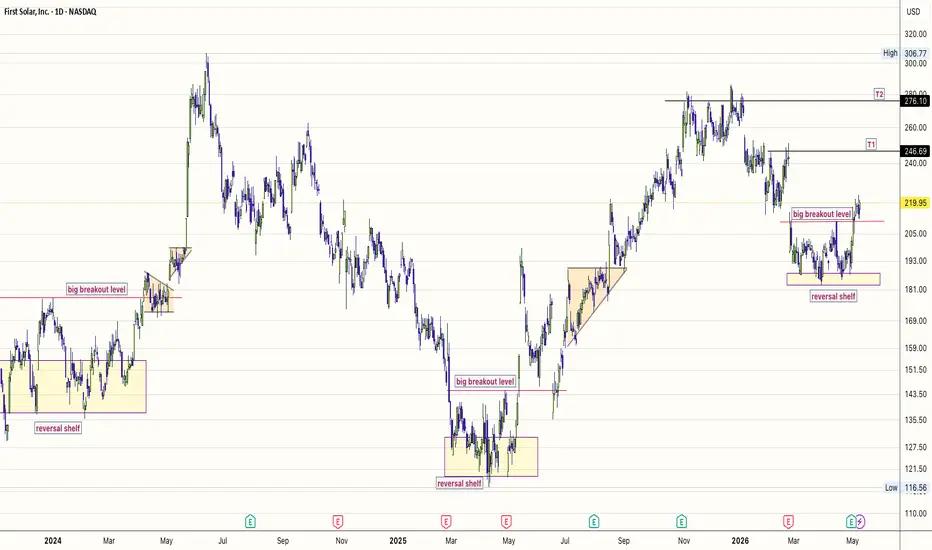
The FSLR chart is a masterclass in structural strength, characterised by a repeated pattern of consolidation followed by explosive upside.
Reversal Shelves: The stock has consistently found a floor at key horizontal "reversal shelves," most recently stabilising in the $181–$193 range before its latest push.
Breakout Success: Each major breakout (e.g., the move past $143.50 in 2025 and $205 in early 2026) has been preceded by a tightening "big breakout level".
Current Resistance: FSLR is currently battling a supply zone at $219.95, with eyes on immediate targets T1 ($246.69) and T2 ($276.10).
A break above the recent high of $285.99 opens the door to the ultimate $306.77 target.
Fundamental Thesis: Earnings & Policy TailwindsWhile the chart shows the momentum, recent financial performance and policy shifts are providing the "fuel" for this staircase rally.
Q1 2026 Earnings Beat: On May 4, 2026, First Solar reported an EPS of $3.22, smashing the $2.87 estimate.
Net sales grew 24% year-over-year to $1.04 billion, driven by massive volume increases in module sales.
Strong Guidance: The company reaffirmed its 2026 outlook, expecting full-year sales between $4.9 billion and $5.2 billion, supported by a robust project backlog.
Policy Catalyst: Analysts at Freedom Capital recently upgraded the stock to a "Strong-Buy" on May 7, citing potential "Section 232" trade tailwinds as the U.S. continues to squeeze China-linked solar competitors.
Institutional Conviction: Goldman Sachs recently upped its price objective to $310, aligning with the short term targets identified on this chart.
#FSLR #FirstSolar #SolarEnergy #Nasdaq100 #RenewableEnergy #TechnicalAnalysis #GrowthStocks #CleanTech #Investing
The
FSLR chart is a masterclass in structural strength, characterised by a repeated pattern of consolidation followed by explosive upside.Reversal Shelves: The stock has consistently found a floor at key horizontal "reversal shelves," most recently stabilising in the $181–$193 range before its latest push.
Breakout Success: Each major breakout (e.g., the move past $143.50 in 2025 and $205 in early 2026) has been preceded by a tightening "big breakout level".
Current Resistance: FSLR is currently battling a supply zone at $219.95, with eyes on immediate targets T1 ($246.69) and T2 ($276.10).
A break above the recent high of $285.99 opens the door to the ultimate $306.77 target.
Fundamental Thesis: Earnings & Policy TailwindsWhile the chart shows the momentum, recent financial performance and policy shifts are providing the "fuel" for this staircase rally.
Q1 2026 Earnings Beat: On May 4, 2026, First Solar reported an EPS of $3.22, smashing the $2.87 estimate.
Net sales grew 24% year-over-year to $1.04 billion, driven by massive volume increases in module sales.
Strong Guidance: The company reaffirmed its 2026 outlook, expecting full-year sales between $4.9 billion and $5.2 billion, supported by a robust project backlog.
Policy Catalyst: Analysts at Freedom Capital recently upgraded the stock to a "Strong-Buy" on May 7, citing potential "Section 232" trade tailwinds as the U.S. continues to squeeze China-linked solar competitors.
Institutional Conviction: Goldman Sachs recently upped its price objective to $310, aligning with the short term targets identified on this chart.
#FSLR #FirstSolar #SolarEnergy #Nasdaq100 #RenewableEnergy #TechnicalAnalysis #GrowthStocks #CleanTech #Investing
Trade chiuso manualmente
#FSLR standing on the B Bands.T2 could happen in todays session or on a gap up tomorrow.
cheers.

Declinazione di responsabilità
Le informazioni e le pubblicazioni non sono intese come, e non costituiscono, consulenza o raccomandazioni finanziarie, di investimento, di trading o di altro tipo fornite o approvate da TradingView. Per ulteriori informazioni, consultare i Termini di utilizzo.
Declinazione di responsabilità
Le informazioni e le pubblicazioni non sono intese come, e non costituiscono, consulenza o raccomandazioni finanziarie, di investimento, di trading o di altro tipo fornite o approvate da TradingView. Per ulteriori informazioni, consultare i Termini di utilizzo.