
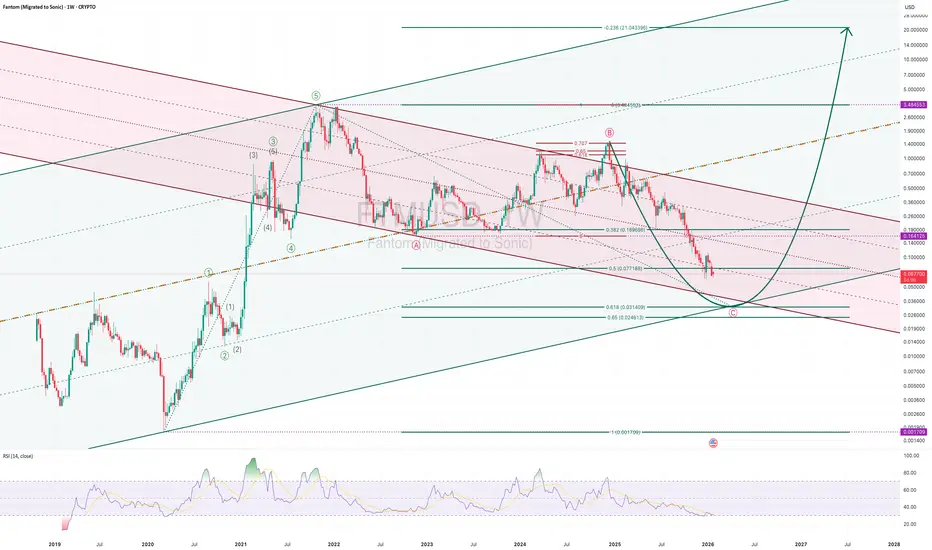
FTM – Weekly Structure Overview
Price completed a clear 5-wave impulse from the 2020 low into the 2021/22 peak. Since then, the market has been unfolding a higher-degree A–B–C correction within a descending channel.
Wave B stalled in the typical 0.618–0.707 Fibonacci retracement zone, followed by an impulsive decline forming Wave C. The current selloff remains technically corrective and is approaching a strong confluence support area between the 0.5–0.618 retracements, aligned with long-term channel support.
Structure suggests late-stage correction, not trend failure.
A completed Wave C would open the door for a new primary impulsive cycle.
[u]Key Takeaways:[/u]
• Macro trend remains structurally intact
• Current price action appears to be late-stage corrective behavior
• No bullish confirmation yet — but downside risk is approaching exhaustion levels
• Patience is required until Wave C completes and structure confirms
Like and follow for more charts like this.
Price completed a clear 5-wave impulse from the 2020 low into the 2021/22 peak. Since then, the market has been unfolding a higher-degree A–B–C correction within a descending channel.
Wave B stalled in the typical 0.618–0.707 Fibonacci retracement zone, followed by an impulsive decline forming Wave C. The current selloff remains technically corrective and is approaching a strong confluence support area between the 0.5–0.618 retracements, aligned with long-term channel support.
Structure suggests late-stage correction, not trend failure.
A completed Wave C would open the door for a new primary impulsive cycle.
[u]Key Takeaways:[/u]
• Macro trend remains structurally intact
• Current price action appears to be late-stage corrective behavior
• No bullish confirmation yet — but downside risk is approaching exhaustion levels
• Patience is required until Wave C completes and structure confirms
Like and follow for more charts like this.
Nota
Wave 4 trading process riding Wave 5 of ((C))Trade attivo
Nota

In technical analysis, several methods focus on higher timeframes to provide a broader, more reliable context for trading or investment decisions. Elliott Wave Principle generally considers historical higher timeframes as mandatory.
Declinazione di responsabilità
Le informazioni e le pubblicazioni non sono intese come, e non costituiscono, consulenza o raccomandazioni finanziarie, di investimento, di trading o di altro tipo fornite o approvate da TradingView. Per ulteriori informazioni, consultare i Termini di utilizzo.
In technical analysis, several methods focus on higher timeframes to provide a broader, more reliable context for trading or investment decisions. Elliott Wave Principle generally considers historical higher timeframes as mandatory.
Declinazione di responsabilità
Le informazioni e le pubblicazioni non sono intese come, e non costituiscono, consulenza o raccomandazioni finanziarie, di investimento, di trading o di altro tipo fornite o approvate da TradingView. Per ulteriori informazioni, consultare i Termini di utilizzo.