
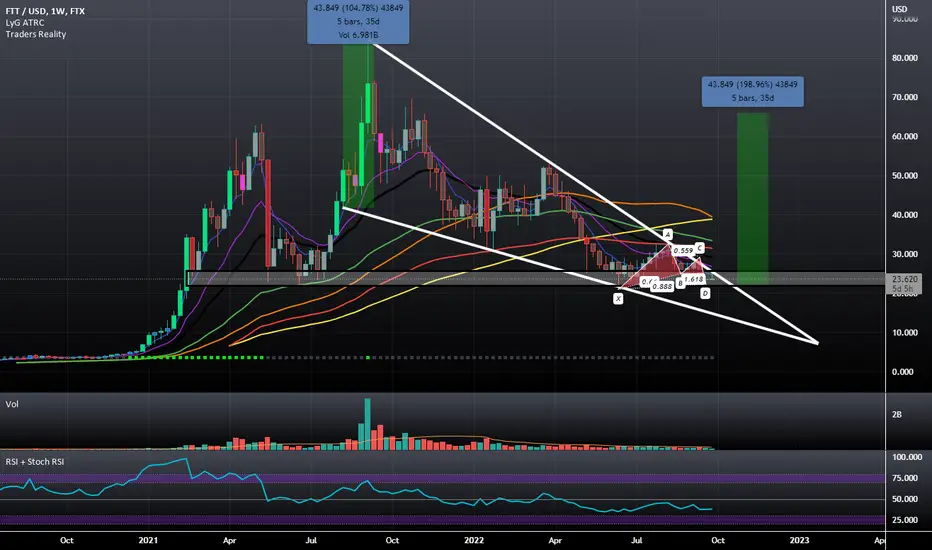
FTT has traded within this Giant Falling Wedge Pattern and is at a Weekly Support Level like the SPX and Nasdaq as well as the Pattern Completion Zone of a Bullish Gartley so Long as it holds above support we should see a Decent Breakout Very soon from here Potentially to $60-$71.

Declinazione di responsabilità
Le informazioni e le pubblicazioni non sono intese come, e non costituiscono, consulenza o raccomandazioni finanziarie, di investimento, di trading o di altro tipo fornite o approvate da TradingView. Per ulteriori informazioni, consultare i Termini di utilizzo.
Declinazione di responsabilità
Le informazioni e le pubblicazioni non sono intese come, e non costituiscono, consulenza o raccomandazioni finanziarie, di investimento, di trading o di altro tipo fornite o approvate da TradingView. Per ulteriori informazioni, consultare i Termini di utilizzo.