
Markets don’t become clear just because momentum appears.
Most of the time, strong moves happen inside imperfect conditions.
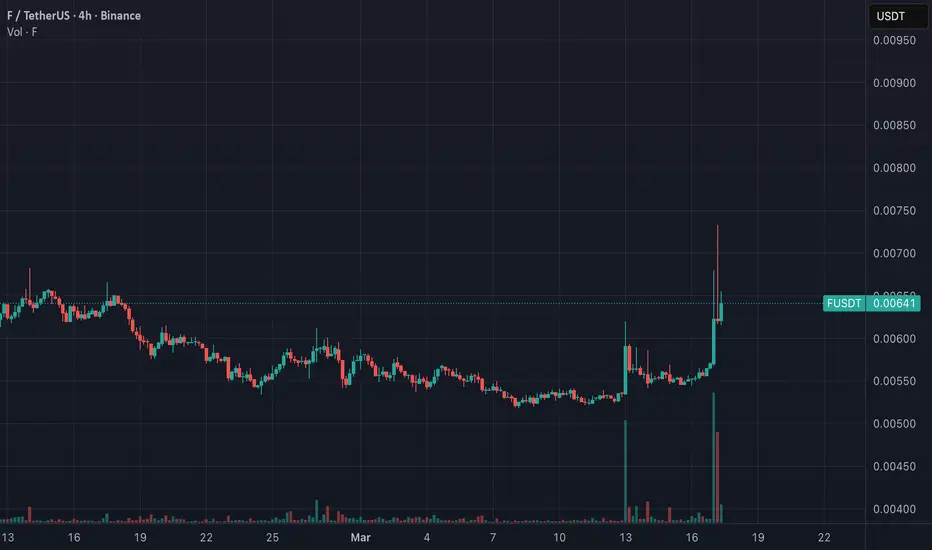
Right now F/USDT is trading near 0.00640, after a fast move higher, approaching resistance around 0.00680.
The broader structure leans bullish, but the environment is not clean.
Here is what the current structure suggests:
• Buyer pressure is present (order book imbalance remains positive)
• Trade flow slightly favors buyers
• Price is holding above short-term support
• Volatility is elevated
But at the same time:
• Volume is below average
• Liquidity is relatively thin
That combination often creates unstable moves rather than clean trends.
Two scenarios from here
Bullish scenario
If price manages to hold above the recent support zone and push toward resistance, continuation may extend toward:
• 0.00655 area
• 0.00680 area
This would confirm that buyers are still in control despite weak volume.
Pullback scenario
If the move loses strength near resistance, the market may rotate back toward support.
The key area to watch then becomes:
• 0.00590 – 0.00600 zone
This is where structure would need to hold to maintain the bullish context.
Practical approach
In conditions like this, the main risk is not direction — it’s instability.
Low liquidity and high volatility can create sharp moves in both directions.
A more structured approach is to observe behavior at key levels:
• Acceptance above resistance → continuation becomes more likely
• Rejection + weak volume → rotation back into range
Support to watch: 0.00590
Resistance to watch: 0.00680
In environments like this, the goal is not prediction.
It’s managing risk around structure.
Most of the time, strong moves happen inside imperfect conditions.
Right now F/USDT is trading near 0.00640, after a fast move higher, approaching resistance around 0.00680.
The broader structure leans bullish, but the environment is not clean.
Here is what the current structure suggests:
• Buyer pressure is present (order book imbalance remains positive)
• Trade flow slightly favors buyers
• Price is holding above short-term support
• Volatility is elevated
But at the same time:
• Volume is below average
• Liquidity is relatively thin
That combination often creates unstable moves rather than clean trends.
Two scenarios from here
Bullish scenario
If price manages to hold above the recent support zone and push toward resistance, continuation may extend toward:
• 0.00655 area
• 0.00680 area
This would confirm that buyers are still in control despite weak volume.
Pullback scenario
If the move loses strength near resistance, the market may rotate back toward support.
The key area to watch then becomes:
• 0.00590 – 0.00600 zone
This is where structure would need to hold to maintain the bullish context.
Practical approach
In conditions like this, the main risk is not direction — it’s instability.
Low liquidity and high volatility can create sharp moves in both directions.
A more structured approach is to observe behavior at key levels:
• Acceptance above resistance → continuation becomes more likely
• Rejection + weak volume → rotation back into range
Support to watch: 0.00590
Resistance to watch: 0.00680
In environments like this, the goal is not prediction.
It’s managing risk around structure.
Trade chiuso manualmente
Markets don’t fail — conditions change.The structure discussed earlier has shifted.
Price is now trading below the key support zone, and the internal structure has weakened.
Here is what changed:
• 1H structure is now broken
• Price lost the 0.00590 support zone
• Market is trading below MA200 across key timeframes
• Selling pressure increased significantly
At the same time:
• No clear higher timeframe support has been established yet
• Volatility remains elevated
This combination often leads to continuation moves rather than immediate reversals.
What this means now
The previous bullish scenario is no longer in play.
The market is now in a no-long structure environment.
That shifts the focus from opportunity → capital protection.
Practical approach
In conditions like this, forcing trades usually leads to mistakes.
A more structured approach is:
• Avoid averaging into weakness
• Watch for reclaim of structure before considering longs
• Use pullbacks for exit decisions, not entries
Key level to monitor:
• Reclaim of 0.00590 zone → first sign of stabilization
Until then, downside pressure remains dominant.
In environments like this, discipline matters more than direction.
🧩 No trade is also a decision.

Declinazione di responsabilità
Le informazioni e le pubblicazioni non sono intese come, e non costituiscono, consulenza o raccomandazioni finanziarie, di investimento, di trading o di altro tipo fornite o approvate da TradingView. Per ulteriori informazioni, consultare i Termini di utilizzo.
Declinazione di responsabilità
Le informazioni e le pubblicazioni non sono intese come, e non costituiscono, consulenza o raccomandazioni finanziarie, di investimento, di trading o di altro tipo fornite o approvate da TradingView. Per ulteriori informazioni, consultare i Termini di utilizzo.