
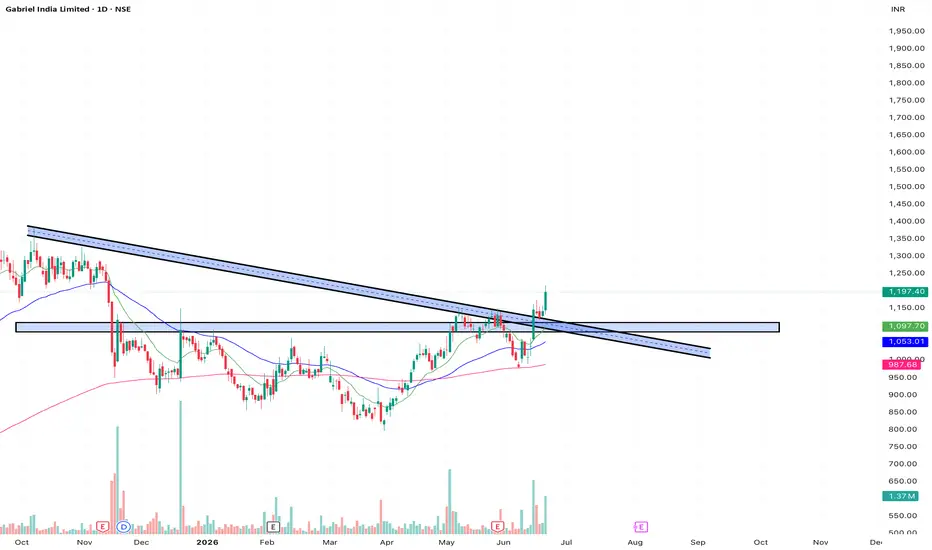
📊 Gabriel India Limited (GABRIEL) - Weekly (1W) Chart Analysis
This post is shared for EDUCATIONAL PURPOSES ONLY to analyze macro trendline breakouts and horizontal resistance flips. This is not financial or investment advice.
🟢 Technical Observations:
1. Macro Trendline Breakout: On the weekly chart, GABRIEL has broken out of a multi-month descending trendline that acted as strong dynamic resistance.
2. Horizontal Resistance Flip: The price has cleared a vital horizontal resistance shelf around 1,100. This structural zone is now expected to act as solid baseline support on any future pullbacks.
3. Bullish Weekly Close: The current weekly candle is a large, decisive green marubozu/continuation candle closing near the highs (~1,197.40), confirming powerful institutional accumulation.
4. Moving Average Support: The price is comfortably fanning out above both the short-term and medium-term moving averages on the weekly frame.
🎯 Educational Swing Setup:
• Entry Zone: 1,120.00 – 1,197.40 (Accumulating on minor intraday pullbacks closer to the 1,100–1,130 flipped support zone offers an optimal risk-to-reward ratio).
• Target 1: 1,320.00 (Psychological level near previous major swing highs)
• Target 2: 1,400.00+ (Extended macro momentum target)
• Invalidation / Stop-Loss: 1,020.00 (A weekly close back below the key moving averages and horizontal structural support invalidates this macro breakout setup).
• Expected Duration: 3 to 6 Weeks (Macro weekly swing view)
⚠️ Risk Management:
Because this is a weekly breakout, allow room for normal retests of the breakout zone. Always manage your position sizing strictly and never chase absolute vertical extensions.
This post is shared for EDUCATIONAL PURPOSES ONLY to analyze macro trendline breakouts and horizontal resistance flips. This is not financial or investment advice.
🟢 Technical Observations:
1. Macro Trendline Breakout: On the weekly chart, GABRIEL has broken out of a multi-month descending trendline that acted as strong dynamic resistance.
2. Horizontal Resistance Flip: The price has cleared a vital horizontal resistance shelf around 1,100. This structural zone is now expected to act as solid baseline support on any future pullbacks.
3. Bullish Weekly Close: The current weekly candle is a large, decisive green marubozu/continuation candle closing near the highs (~1,197.40), confirming powerful institutional accumulation.
4. Moving Average Support: The price is comfortably fanning out above both the short-term and medium-term moving averages on the weekly frame.
🎯 Educational Swing Setup:
• Entry Zone: 1,120.00 – 1,197.40 (Accumulating on minor intraday pullbacks closer to the 1,100–1,130 flipped support zone offers an optimal risk-to-reward ratio).
• Target 1: 1,320.00 (Psychological level near previous major swing highs)
• Target 2: 1,400.00+ (Extended macro momentum target)
• Invalidation / Stop-Loss: 1,020.00 (A weekly close back below the key moving averages and horizontal structural support invalidates this macro breakout setup).
• Expected Duration: 3 to 6 Weeks (Macro weekly swing view)
⚠️ Risk Management:
Because this is a weekly breakout, allow room for normal retests of the breakout zone. Always manage your position sizing strictly and never chase absolute vertical extensions.
Trade attivo
T1 done i am always right
Trade chiuso: obiettivo raggiunto
T2 donei am always right

Declinazione di responsabilità
Le informazioni e le pubblicazioni non sono intese come, e non costituiscono, consulenza o raccomandazioni finanziarie, di investimento, di trading o di altro tipo fornite o approvate da TradingView. Per ulteriori informazioni, consultare i Termini di utilizzo.
Declinazione di responsabilità
Le informazioni e le pubblicazioni non sono intese come, e non costituiscono, consulenza o raccomandazioni finanziarie, di investimento, di trading o di altro tipo fornite o approvate da TradingView. Per ulteriori informazioni, consultare i Termini di utilizzo.