

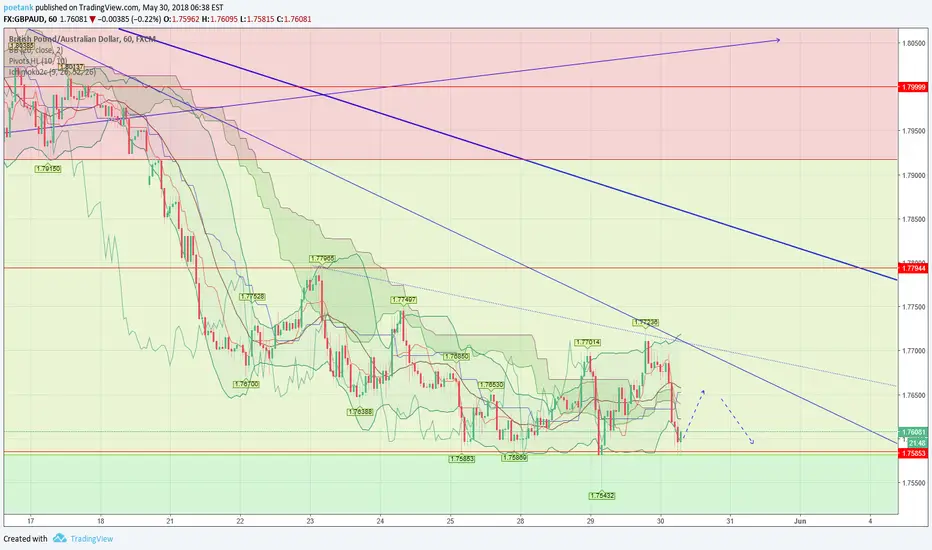
GBPAUD H1 Chart
It has repeatedly returned from the same support line
Again, the formation of a peak can be expected.
If it break the support line and the green field is closing, the price may fall to a very low level.
If it ascends, it will go up to the blue line and fall back.
If it passes the thin blue line, it goes up to the thick blue line.
***This information is not a recommendation to buy or sell. It is to be used for educational purposes only.***
I'm sorry for the impaired expression..Just watch the chart, not what I write. :)
PS make sure you give me a like, If you LIKE this analysis .... If you like most of my analyzes, FOLLOW me.
GBPAUD Daily Chart

It has repeatedly returned from the same support line
Again, the formation of a peak can be expected.
If it break the support line and the green field is closing, the price may fall to a very low level.
If it ascends, it will go up to the blue line and fall back.
If it passes the thin blue line, it goes up to the thick blue line.
***This information is not a recommendation to buy or sell. It is to be used for educational purposes only.***
I'm sorry for the impaired expression..Just watch the chart, not what I write. :)
PS make sure you give me a like, If you LIKE this analysis .... If you like most of my analyzes, FOLLOW me.
GBPAUD Daily Chart
Trade chiuso: obiettivo raggiunto

Declinazione di responsabilità
Le informazioni e le pubblicazioni non sono intese come, e non costituiscono, consulenza o raccomandazioni finanziarie, di investimento, di trading o di altro tipo fornite o approvate da TradingView. Per ulteriori informazioni, consultare i Termini di utilizzo.
Declinazione di responsabilità
Le informazioni e le pubblicazioni non sono intese come, e non costituiscono, consulenza o raccomandazioni finanziarie, di investimento, di trading o di altro tipo fornite o approvate da TradingView. Per ulteriori informazioni, consultare i Termini di utilizzo.