

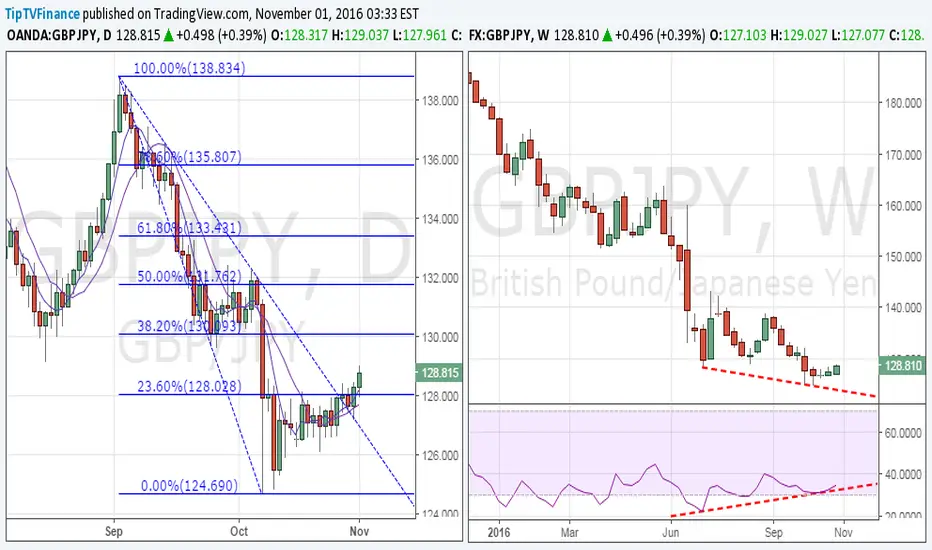
Daily/Weekly chart
· The pair finally closed above 128.03 (23.6% Fibo of Sept high and Oct low) after having repeated failed to do so last month. Also note the bullish 5-DMA and 10-DMA crossover.
· On the weekly chart, we have a bullish price RSI divergence. Consequently, the cross looks poised for a rise to 130.10 (38.2% Fibo).
· On the other hand, only a daily close below 127.19 (previous day’s low) would signal bullish invalidation.
· The pair finally closed above 128.03 (23.6% Fibo of Sept high and Oct low) after having repeated failed to do so last month. Also note the bullish 5-DMA and 10-DMA crossover.
· On the weekly chart, we have a bullish price RSI divergence. Consequently, the cross looks poised for a rise to 130.10 (38.2% Fibo).
· On the other hand, only a daily close below 127.19 (previous day’s low) would signal bullish invalidation.

Declinazione di responsabilità
Le informazioni e le pubblicazioni non sono intese come, e non costituiscono, consulenza o raccomandazioni finanziarie, di investimento, di trading o di altro tipo fornite o approvate da TradingView. Per ulteriori informazioni, consultare i Termini di utilizzo.
Declinazione di responsabilità
Le informazioni e le pubblicazioni non sono intese come, e non costituiscono, consulenza o raccomandazioni finanziarie, di investimento, di trading o di altro tipo fornite o approvate da TradingView. Per ulteriori informazioni, consultare i Termini di utilizzo.