

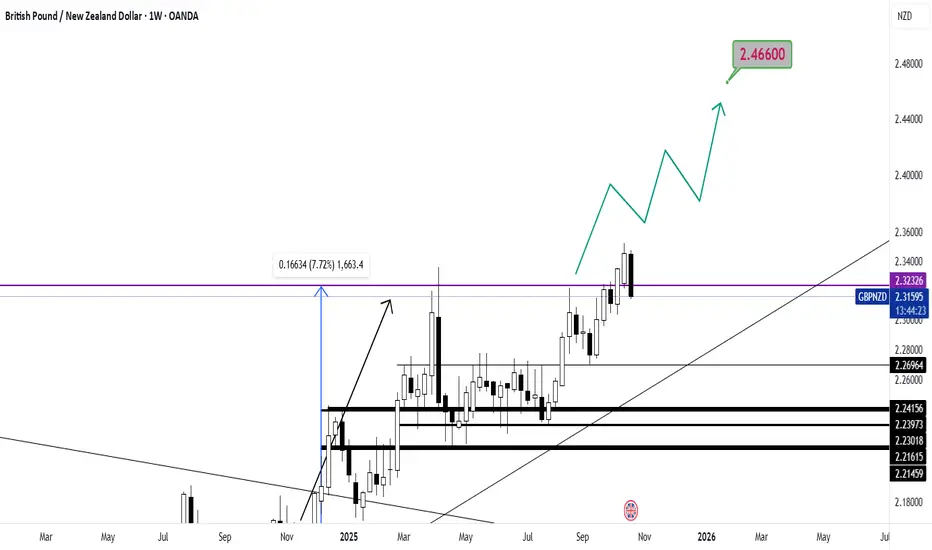
What appears on the chart is a change in the direction of upward fluctuations!
Now, why should these upward fluctuations or upward prospects appear on the chart, is a question that must be answered over time!
I hope that this time, like the previous analysis, we will reach the desired results with this indicator!
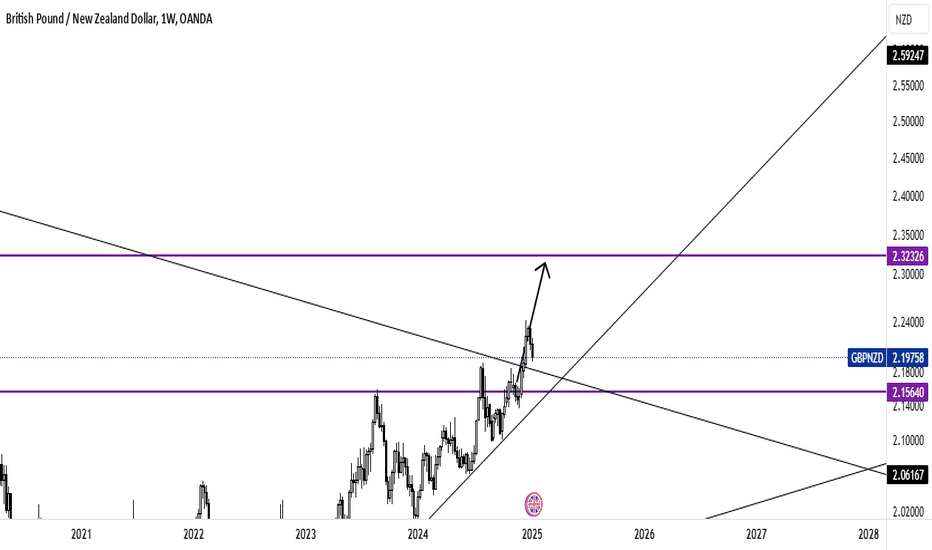
Good luck...
Now, why should these upward fluctuations or upward prospects appear on the chart, is a question that must be answered over time!
I hope that this time, like the previous analysis, we will reach the desired results with this indicator!
Good luck...

Declinazione di responsabilità
Le informazioni e le pubblicazioni non sono intese come, e non costituiscono, consulenza o raccomandazioni finanziarie, di investimento, di trading o di altro tipo fornite o approvate da TradingView. Per ulteriori informazioni, consultare i Termini di utilizzo.
Declinazione di responsabilità
Le informazioni e le pubblicazioni non sono intese come, e non costituiscono, consulenza o raccomandazioni finanziarie, di investimento, di trading o di altro tipo fornite o approvate da TradingView. Per ulteriori informazioni, consultare i Termini di utilizzo.